Loading...
No results

How to Use Pine Script for Trading on TradingView

Fusion Markets

post content image

Read Time: 10-12 Minutes


There are a number of ways to automate your trading with the programming language you use depending on the platform you trade on. For example, MetaTrader 4/5 traders use EAs coded in mql4/5, cTrader uses cbots coded in c#, and TradingView traders use Pinescript.  


Pine Script is a domain-specific language developed by TradingView that allows traders to create custom technical indicators and strategies, turning the platform into a powerhouse for market analysis.  


In this blog post, we will walk you through everything you need to know about using PineScript for Forex trading. 


Contents


  1. What Is PineScript
  2. Getting Started
  3. PineScript Syntax
  4. Developing Strategies
  5. Backtesting Your Strategy
  6. Common Pitfalls to Avoid
  7. Conclusion


    What Is PineScript


    PineScript is a coding language developed by TradingView specifically for creating indicators and strategies on their platform. It is similar to other programming languages, but with its own unique syntax and functions tailored for trading analysis.  


    Don't let the idea of coding scare you – the syntax is similar to other popular languages like JavaScript and C++, making it easy for traders with coding experience to pick up. Plus, with the large online community and resources available, you can easily learn and use Pinescript in a matter of days. 


    Getting Started


    To start using PineScript on TradingView, you will need a TradingView account. If you don't have one yet, go ahead and sign up – it's free! Make sure to connect it to your Fusion Markets account. Once you have an account, navigate to the "Pine Editor" tab on the top menu bar. 


    Next, open the PineScript editor on TradingView and choose from a variety of templates or start from scratch. The editor also includes a preview function that allows you to see how your code will look on a chart in real-time. 


    You will also need to have a basic understanding of coding concepts such as variables, functions, and conditional statements. If these terms sound foreign to you, don't worry we’ve got you covered!  


    PineScript Syntax


    At the core of Pine Script's functionality is its syntax, which forms the building blocks of any script. Its power lies in its simplicity and flexibility, enabling users to craft a wide array of technical analysis tools.  


    Here are a few main things that you should know: 


    Variables and Data Types 


    Variables in Pine Script play a crucial role in storing and manipulating data. They come in different types such as integers, floats, bools, strings, and series. Variables in PineScript are declared using the "var" keyword, followed by the variable name and an equal sign (=) before the value assigned to it. For example: `var myVariable = 10;`.   


    Understanding these data types is fundamental. For instance, a series type is used for time series data, enabling the creation of moving averages, oscillators, and more. 


    undefined


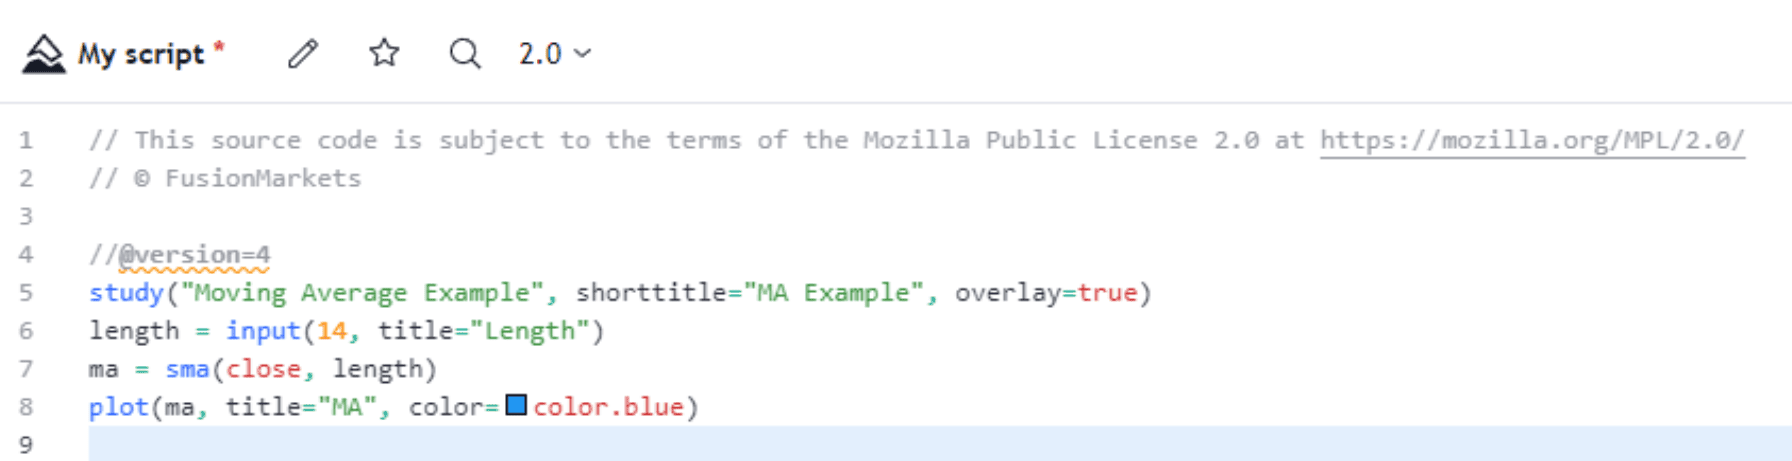
    In this example, ` length` is an integer variable that stores the input value for the length of the moving average, and ma is a series variable that stores the moving average data. 


    Functions and Operators 


    Pine Script offers an extensive range of built-in functions and operators for performing calculations and executing specific actions. Functions in PineScript start with the "study" keyword, followed by the name of the function and parentheses. For example: `study("My Custom Indicator")`   


    Functions like ` sma() ` (simple moving average) and ` plot() ` aid in technical analysis by computing indicators and displaying plotted lines on the chart.  


    Functions and Operators 


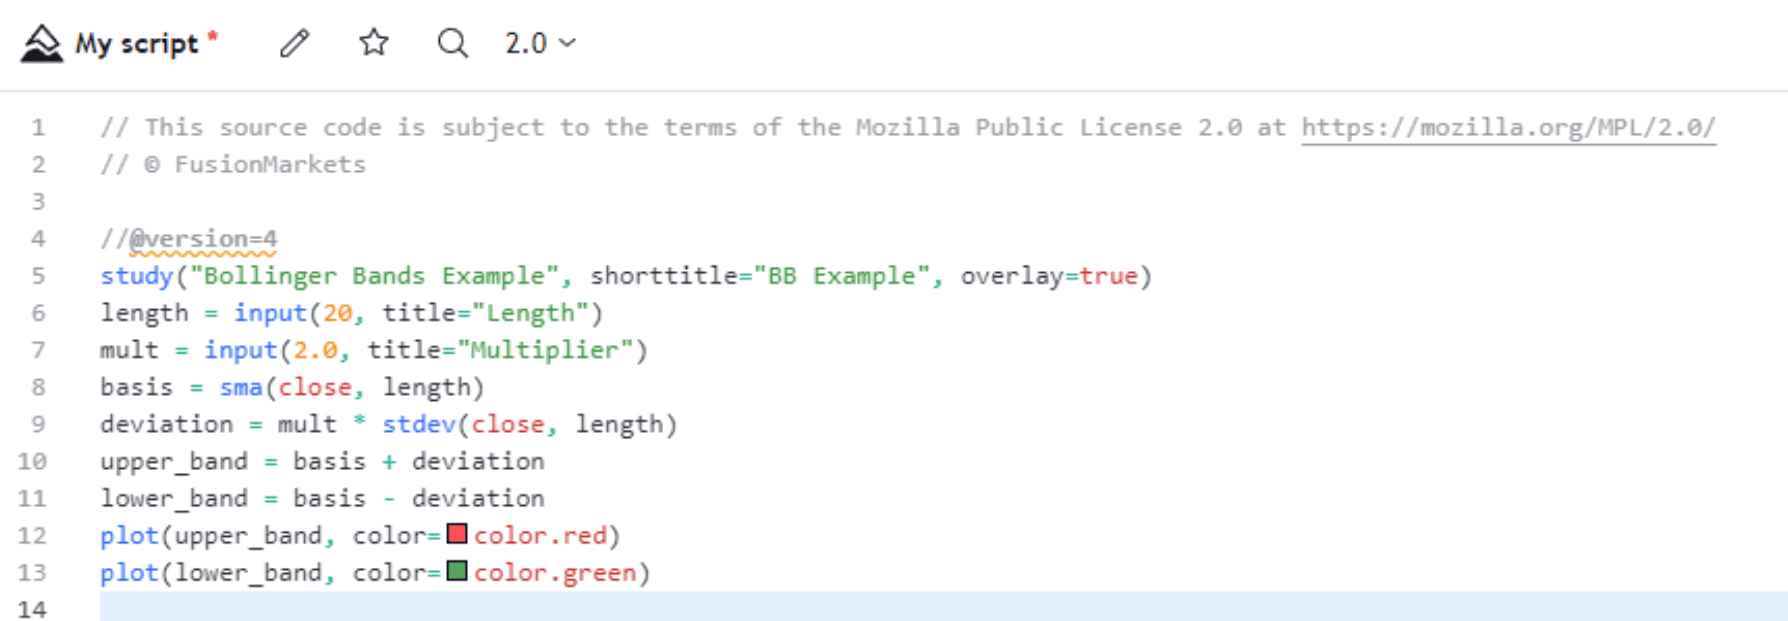
    Here, ` sma() `, ` stdev() `, and arithmetic operators (` + `, ` ` -) are used to compute Bollinger Bands by calculating the moving average, standard deviation, and upper and lower bands. 


    Conditional Statements and Loops 


    Conditional statements and loops are essential for decision-making and iterative processes. Using ` if-else` statements and ` for ` loops, traders can create dynamic conditions and repetitive actions within their scripts. 


    undefined


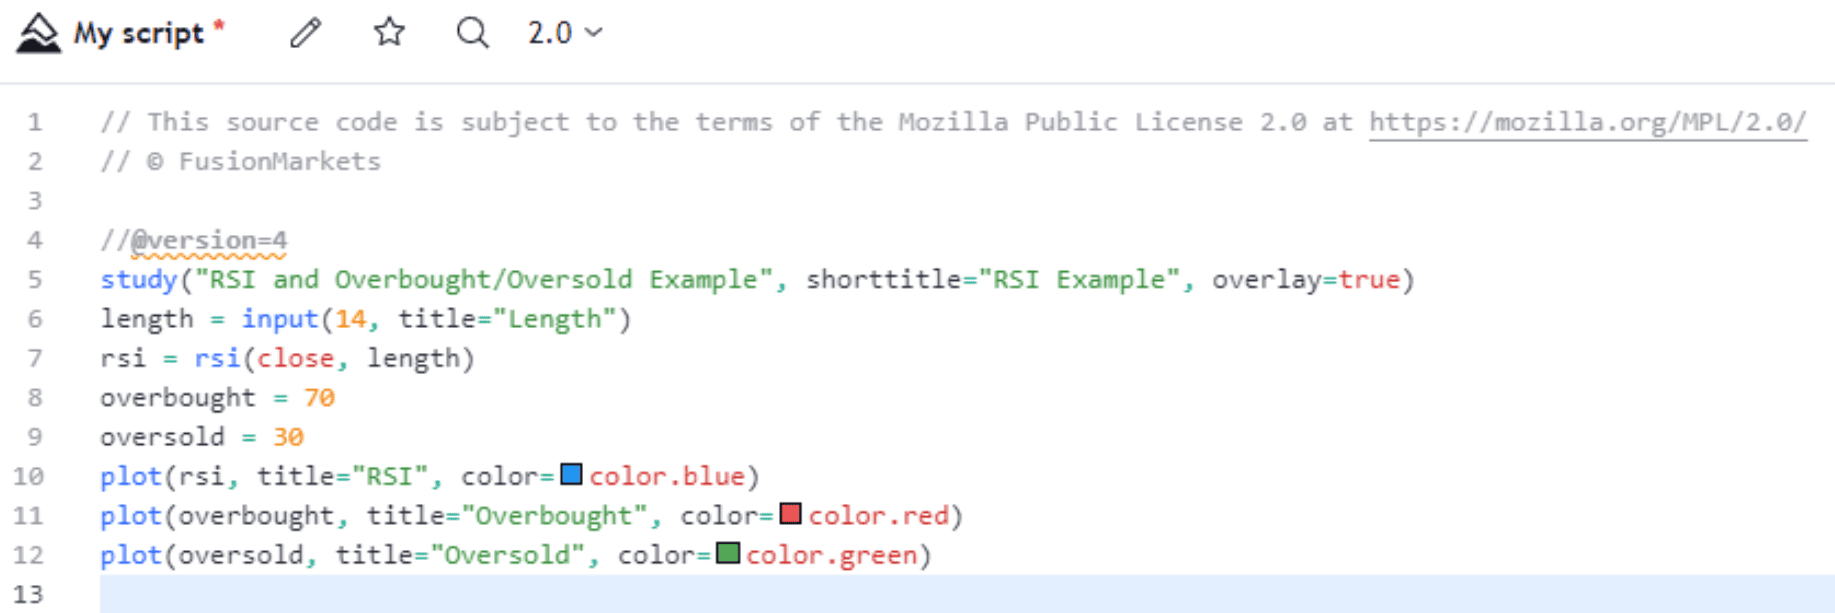
    In this snippet, an RSI (Relative Strength Index) script displays the RSI values along with overbought and oversold levels. Conditional statements can be applied to trigger alerts or make trading decisions based on RSI levels crossing certain thresholds. 


    Understanding variables, functions, conditional statements, and loops is pivotal for crafting effective indicators and strategies. With a solid grasp of PineScript syntax, traders can develop personalised trading tools, enhancing their analysis and decision-making in the financial markets. To learn more about the syntax, please refer to the PineScript language manual. 


    Creating Custom Indicators 


    One of the most popular uses for PineScript is creating custom indicators. This can range from simple moving averages to complex algorithms that incorporate various technical analysis tools. The possibilities are endless, and with some creativity and testing, you can come up with unique and effective indicators for your trading strategy. 


    Now, let's walk through the process of creating a simple moving average (SMA) indicator using Pine Script. An SMA is a popular trend-following indicator that smoothens price data to identify the underlying trend. 
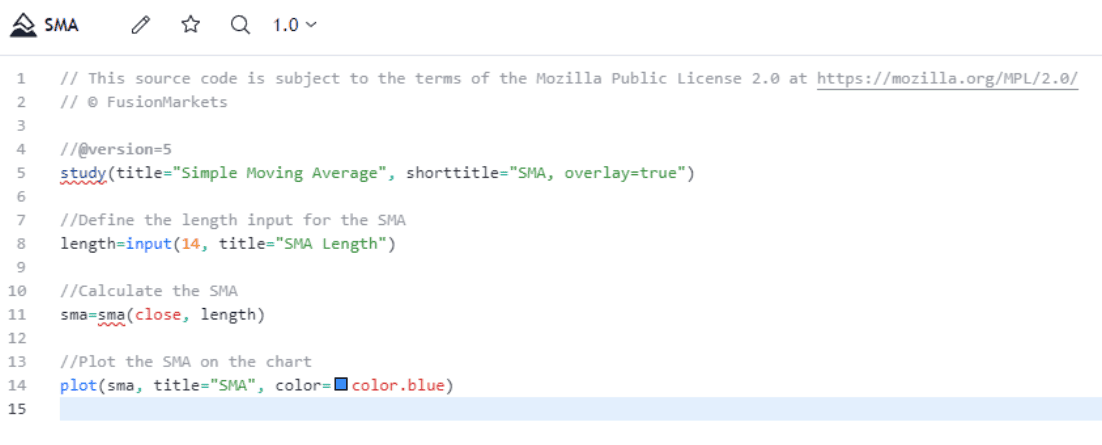


    undefined


    In this script: 


    • We specify the title, short title, and overlay properties for the indicator. 

    • We create an input variable, length, that allows the user to customise the length of the SMA. 

    • We calculate the SMA using the sma() function. 

    • We use the plot() function to display the SMA on the chart. 


    This is just a basic example to get you started. Why don’t we take it up a notch? 


    Let’s create a strategy that uses the 200 Exponential Moving Average (EMA) as a basis for making buy (long) signals when the price crosses above this moving average. 


    undefined


    Let's break down the code: 


    • Setting up Strategy Parameters: The script sets the strategy's title, short title, and indicates that it's an overlay on the price chart using strategy(). 

    • Calculating the 200 EMA: It defines a 200-period EMA (ema200) based on the closing prices. 

    • Plotting the 200 EMA: The script plots the 200 EMA on the chart in blue. 

    • Identifying EMA Crossover: It calculates the points where the closing price crosses above the 200 EMA using ta.crossover() and assigns these points to the variable emaCrossover. 

    • Strategy Entry Conditions: When the crossover happens (i.e., when the closing price crosses above the 200 EMA), the strategy generates a "Buy" entry signal using strategy.entry() with the condition when=emaCrossover. 

    • Plotting Buy Signals: The script uses plotshape() to plot small green triangles below the price bars where the crossover condition is met. 


    Here’s how it looks on a chart: 
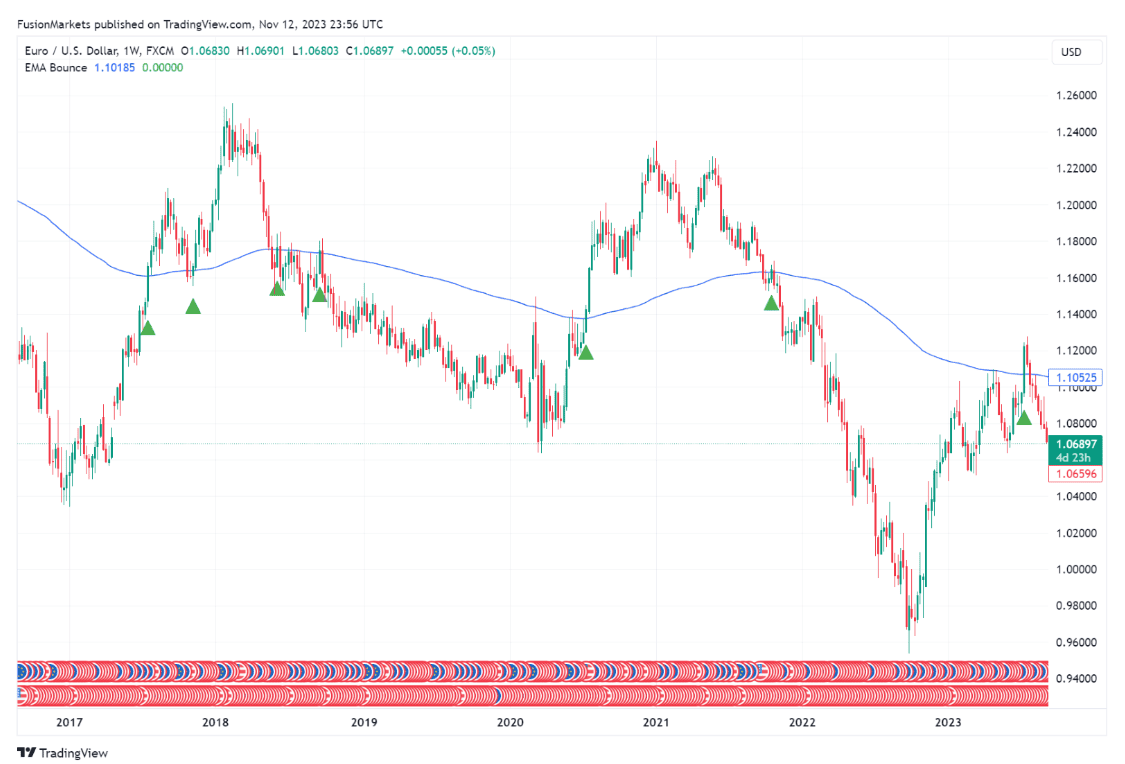

    undefined


    EURUSD Weekly Chart 


    Kindly be aware that the script provided above serves as an example, and it will require adjustments to align with your particular objectives. 


    In summary, this script creates buy signals (represented by green triangles below the price bars) whenever the closing price crosses above the 200-period Exponential Moving Average. This strategy assumes that such crossovers might indicate a potential upward trend and trigger a buy action. 


    As you can see, Pine Script is incredibly versatile, and you can create highly sophisticated indicators with complex logic to match your trading strategy.


    Developing Strategies

    Aside from creating indicators, PineScript also allows you to develop fully automated trading strategies. By combining different technical indicators and conditions, you can create a set of rules for buying and selling that can be backtested and optimised for maximum profitability. This feature is especially beneficial for traders who prefer a systematic approach to trading. 


    Tips and Tricks 


    • Start with a clear and well-defined trading strategy: Before jumping into coding, it's essential to have a solid understanding of your trading approach and goals. A clear strategy will make it easier to translate it into code and avoid any confusion during development.  

    • Use proper risk management techniques: No matter how well-crafted a strategy is, managing risk is crucial in trading. PineScript offers functions for setting stop-loss and take-profit levels, as well as position sizing based on risk percentage. Utilising these functions can help minimise losses and maximize gains.  

    • Test and refine: Developing a successful trading strategy takes time, patience, and continuous testing. Backtesting with PineScript allows for this refinement process, where traders can analyse the results of their strategies and make necessary adjustments until it meets their expectations.  


    Backtesting Your Strategy


    Once you've written your Pine Script, it's time to test its performance in various market conditions. TradingView makes this process seamless. You can choose the time frame and historical data you want to test your strategy against. The platform will then run your script against that data, showing you how your strategy would have performed. It helps identify any flaws or weaknesses in the strategy and allows for adjustments before risking real capital. This can significantly increase the chances of success in live trading. 


    Common Pitfalls to Avoid


    While Pine Script provides endless possibilities for developing your strategies, there are common pitfalls to avoid: 


    • Over-Optimisation: Tweaking your strategy too much based on past data can lead to over-optimisation. Your strategy may perform well historically but fail in real-time trading. 

    • Neglecting Risk Management: Not paying enough attention to risk management can lead to significant losses. It's crucial to protect your capital at all costs. 

    • Lack of Patience: Don't rush into live trading. The more time you spend testing and refining your strategy, the better it will perform in the long run. 

    • Ignoring Market Conditions: Markets are not static, and what works in one type of market might not work in another. Keep an eye on market conditions and be ready to adapt. 


    Conclusion


    There's a saying in the world of forex trading - "The trend is your friend". And with PineScript, you can easily identify and follow market trends with custom indicators that suit your trading style. From simple moving averages to complex multi-indicator strategies, PineScript allows you to create and test different approaches until you find the one that works best for you. 


    But PineScript is not just limited to forex trading. It can also be used in other markets such as stocks and cryptocurrencies. So, if you're a multi-asset trader, learning how to use PineScript can greatly benefit your overall trading strategy and performance. 


    Furthermore, PineScript is constantly evolving and being updated with new features. This means that there's always something new to learn and experiment with, keeping your trading skills fresh and adaptable. 


    And don't be intimidated by coding - embrace it with PineScript and see how it can enhance your trading. Who knows, you may even discover a hidden passion for programming along the way! 


We’ll never share your email with third-parties. Opt-out anytime.

Relevant articles

Beginners
post image main
Leveraging Economic Indicators

Read Time: 6 minutes


For successful forex trading, economic indicators are essential tools in understanding market trends and predicting potential currency movements. These indicators, such as GDP, employment data, inflation rates, and more, provide a window into the economic health of a country, which ultimately influences currency values across the market.  

Understanding the influence of economic indicators allows you to make informed decisions based on more accurate analysis, increasing the likelihood of profitable trades.  


Table of Contents


Key Economic Indicators


Gross Domestic Product (GDP)


GDP is the total market value of all goods and services produced within a country, reflecting its economic health.

A rising GDP often signifies a strong, growing economy, which can boost a nation’s currency due to investor confidence. Conversely, a declining GDP might signal economic trouble, potentially weakening the currency. For forex trading, GDP data can help identify long-term currency trends, particularly when compared across different nations.


Employment Data


Employment data is a major economic indicator with a substantial impact on currency values, particularly the Non-Farm Payrolls (NFP) data in the United States.

The NFP measures employment changes outside the farming sector, providing a snapshot of the U.S. job market. When job creation is strong, it suggests economic health, often strengthening the currency as investors and traders feel confident.

Weak employment figures can suggest economic issues, potentially leading to currency depreciation. Since employment is closely tied to consumer spending and economic stability, this data can be very valuable for traders.


Inflation Rates


Inflation, primarily measured by the Consumer Price Index (CPI), reflects the rate at which prices for goods and services increase.

Moderate inflation is generally healthy, indicating a growing economy. However, high inflation can devalue a currency as purchasing power declines. Central banks often adjust interest rates in response to inflation; if inflation is high, they may raise rates to control it, which can attract foreign investors seeking higher returns, thus strengthening the currency. Understanding inflation’s impact on interest rates and currency valuation is vital for forex traders.


Interest Rates


Interest rates are the cost of borrowing or the return on savings, set by central banks to regulate economic activity and influence currency value.

Interest rates are among the most influential economic indicators in forex. Central banks set these rates based on economic conditions, adjusting them to either stimulate or cool down the economy. Higher interest rates often attract foreign investment, increasing demand for the currency and boosting its value. Conversely, lower interest rates can make a currency less appealing to investors, leading to depreciation. For forex trading, interest rate changes and the policies of central banks (such as the Federal Reserve in the U.S. or the Reserve Bank of Australia) provide critical insights into likely currency movements.


Consumer Confidence Index (CCI)


The Consumer Confidence Index measures consumer sentiment and expectations regarding the economy.

High consumer confidence can indicate increased spending, which drives economic growth, while low confidence suggests economic uncertainty. CCI is considered a leading indicator, as consumer sentiment often precedes actual economic changes. When consumers feel positive about the economy, the currency may strengthen; when confidence drops, the currency may weaken. Forex traders use the CCI to anticipate changes in spending behaviour and overall economic direction.


Interpreting Economic Indicators


In forex trading, interpreting economic indicators requires understanding both individual data points and the relationships between them. Economic indicators can influence currency values in varying degrees, with some holding more weight than others. Traders must also consider correlations, as indicators like GDP and employment data often move together, giving a clearer picture of economic health.

One challenge traders face is managing contradictory signals. For example, strong employment data may suggest a strong currency, but if inflation is simultaneously high, it could lead to fiscal and monetary policy changes, ultimately impacting the currency differently. Weighing the significance of each indicator helps traders decide when to take action and which indicators align with their trading objectives.


Essential Economic Indicators and Practical Application


- For traders just starting with fundamental analysis, some economic indicators offer a straightforward approach to understanding market dynamics:

- Non-Farm Payrolls (NFP): Released monthly by the U.S. Bureau of Labor Statistics, NFP provides a quick look at employment trends, making it a critical indicator for traders.

- Consumer Price Index (CPI): CPI reflects inflation and purchasing power, directly influencing central bank policy and forex rates.

- Central Bank Interest Rate Decisions: Rate changes have immediate and often lasting impacts on currency valuation, making them a fundamental factor in forex trading.

You can find the details of every economic data event using our Economic Calendar.

Accessing timely and reliable economic data is crucial. Many traders use economic calendars, such as our one here, which provide release dates for upcoming economic data, allowing them to plan trades around these announcements. Economic calendars are invaluable tools for tracking data releases, setting alerts, and managing expectations for market volatility.

It's also important to be mindful of common misinterpretations, such as assuming that a single indicator will drive long-term trends. Forex markets are influenced by a multitude of factors, so it’s essential to view each indicator within a broader economic context.


Synergising Economic Indicators with Technical Analysis


Whilst economic indicators provide insights into a currency’s underlying strength, technical analysis offers real-time insights into price patterns and potential entry points. Combining fundamental and technical analysis enables traders to balance economic data with chart patterns, enhancing trade timing and precision. For instance, fundamental economic indicators can provide you with a long-term bias, and technical analysis can be used to find entries and exits in the direction of that bias.


Advanced Trading Techniques


Timing Your Trades


Timing is crucial when trading around economic data releases. Pre-release analysis allows traders to set expectations based on market consensus, whilst post-release strategies can help manage volatility once the data is out. Our Economic Calendar is an indispensable resource in this regard, assisting you in aligning trades with significant data releases and prepare for potential shifts.


Integrating Indicators into Your Trading Strategy


Developing a comprehensive trading strategy involves diversifying currency pairs based on each currency’s economic indicators. For instance, trading a U.S.-based currency pair based on NFP data, while trading an Australian pair based on the RBA’s interest rate decisions, can provide a balanced approach. Incorporating adaptive risk management around key data release dates can help traders mitigate the risks associated with high-impact news events.


Conclusion


Economic indicators are invaluable resources for forex traders, offering insights that can guide trading strategies and improve profitability. By understanding these economic indicators, you can better anticipate currency movements and make informed decisions. However, mastering these indicators requires continuous learning and constant observation.

Ultimately, leveraging economic data within a broader market analysis framework supports responsible trading practices and provides you with an additional source of information to make better trading decisions.


Remember: Successful forex trading requires a balance of economic insight, technical skill, and disciplined risk management. Stay informed, practice consistently, and adapt your strategies to ever-changing market conditions.

07/01/2025
Beginners
post image main
Understanding Digital Threats with Broker Chooser

Read Time: 3 Minutes

recent study by BrokerChooser has provided valuable insights into the complex world of online investment fraud, highlighting critical trends that every trader should understand. 


Understanding the Digital Threat 


BrokerChooser's research analysed 1.3 million articles across 56 languages, revealing the sophisticated methods used by fraudulent financial entities. Their findings offer a crucial lens through which we can examine digital financial risks. 


Our Commitment to Trader Protection 


Fusion Markets takes these insights seriously. As a regulated broker operating under both the Vanuatu Financial Services Commission and the Australian Securities and Investment Commission, we've developed a comprehensive approach to safeguarding our clients: 

  • Regulatory Compliance: Maintaining rigorous standards of transparency Identity  

  • Verification: Comprehensive checks to prevent fraudulent activities. 

  • Security Awareness: Ongoing training programmes to help traders identify potential risks 


Key Insights from BrokerChooser's Research 


The study highlighted several critical observations: 

  • Fraudulent entities increasingly use artificial intelligence to appear credible 

  • Cryptocurrency remains a primary target for scam operations 

  • Certain European regions show higher concentrations of fraudulent search activity 


Protecting Yourself in the Digital Trading Landscape 


Drawing from both our experience and Broker Choosers research, we recommend: 

  • Thoroughly researching trading platforms 

  • Verifying regulatory credentials 

  • Maintaining a healthy scepticism towards guaranteed returns 

  • Understanding that all investments carry inherent risks 


The Bigger Picture 


While BrokerChooser's research provides critical data, the real protection comes from continuous education and awareness. Their work serves as an important reminder of the evolving nature of digital financial risks. 


A Commitment to Transparency 


We continue to invest in robust security measures, ongoing trader education, and proactive risk management. Our goal is to provide a secure, transparent trading environment that prioritises our clients' safety and understanding. 

The full research report can be downloaded at https://brokerchooser.com/safe-investing


Stay informed. Stay protected. 

05/12/2024
Ready to Start Trading?
Get started live or get a free demo