How Traders Use CFTC Data to Read the Forex Market

Read Time: 3-4 minutes
Released every Friday, the U.S. Commodity Futures Trading Commission (CFTC) releases the Commitment of Traders (COT) report. At first glance, it’s just a table full of numbers. But for traders who know how to read it, the report can offer a powerful view into market positioning – showing where the “big money” might be sitting.
In this post, we’ll break down what CFTC data is, how to interpret it, the different ways traders use it, and the pros and cons of relying on positioning to guide forex decisions.
- What is CFTC Data?
- Spotting Extremes
- Confirming Momentum
- Watching the Shifts
- A Word of Caution
- Bottom Line
The CFTC’s Commitment of Traders report tracks the positions held by three main groups in U.S. futures markets:
- Commercials (hedgers): Corporations, exporters, and banks who use futures to hedge risk.
- Non-commercials (speculators): Hedge funds, asset managers, and traders who speculate on price moves.
- Non-reportables (small traders): Retail participants whose positions are too small to break out separately.
For those trading forex, the most useful category is non-commercials, since they reflect speculative positioning – the type of buying and selling pressure most similar to your own trading activity.
CFTC data can be accessed for free via the CFTC website here. [https://www.cftc.gov/MarketReports/CommitmentsofTraders/index.htm]
There are, however, other options for accessing CFTC data – including Bloomberg, Refinitiv, or for those on a budget, BarChart.com.
One common way to use CFTC data is to look for extreme positioning. When speculators are heavily long or short a currency, it often suggests the trade is crowded. If everyone is already positioned one way, there may be limited fuel left to push the move further.
For example, if net-long USD positions hit record highs while the dollar is surging, it might hint that a reversal is near. Not because the fundamentals have changed, but because sentiment may have reached a tipping point.
Below is a perfect example of BarChart.com’s COT’s chart on US Dollar Futures:
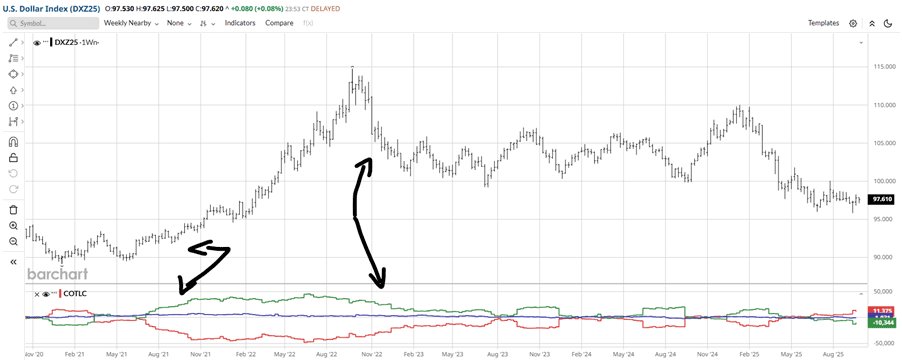
If we pay attention to the green line at the bottom of the chart – which is the non-commercials (hedge funds, asset managers etc), we can see that their net long positions were increasing as the US Dollar appreciated in value. Once more, we can see the selling-off of their positioning that coincides with the US Dollar deprecating.
On the flip side, positioning trends can also confirm when a market move is genuine. If speculators are steadily adding to their longs in AUD futures while AUD/USD is trending higher, it suggests strong conviction is behind the move. That combination – fundamentals, price action, and positioning all lining up – is powerful evidence that the trend is more than noise.
It’s not only the extremes that matter. Sometimes the pace of change tells its own story. A sharp reduction in EUR longs ahead of an ECB meeting, or a sudden swing from net-short to net-long in JPY futures, can reveal shifts in sentiment before they’re obvious on the chart.
Traders often look at the weekly change in net positions, rather than just the headline number, for this reason. It’s not the absolute level that counts, but how quickly it’s moving.
The biggest limitation is lag. The report is published on Friday but reflects positions as of Tuesday on a weekly basis, which means you’re always working with information that’s a few days old. As you can imagine, in fast-moving markets, that can feel like a lifetime.
It’s also worth remembering that the large players’ speculative positions can remain stretched for long periods, particularly in strong trends. Traders who jump in too early expecting a reversal often find themselves fighting against the tide and encountering many losses.
That’s why most professionals don’t use CFTC data in isolation. It’s far more powerful when combined with other tools – technical analysis, macro events, or volatility studies. Think of it as context, not a signal generator.
CFTC data isn’t about predicting the next tick or finding the perfect entry for quick trades. It’s about understanding the bigger picture – where the large players have their money, whether sentiment is stretched, and how that fits with what you’re seeing on the chart.
When all the pieces align you might observe a market at an extreme, price action flashing a reversal, and CFTC data showing a crowded trade – in which case you’ve got a story worth paying attention to. And in a world where headlines and noise can dominate, having a tool that helps you cut through and measure positioning is worth its weight in gold.
We’ll never share your email with third-parties. Opt-out anytime.