Top Indicators for Forex Trading and How to Use Them
Read Time: 8 minutes
“I used fundamentals for nine years and got rich as a technician”
– Martin S. Schwartz
(author of Pit Bull: Lessons from Wall Street's Champion Day Trader).
Are you leveraging the power of forex indicators in your trading strategy? Indicators play a vital role in identifying trends, assessing price momentum, and pinpointing potential entry and exit points.
Whilst no single indicator guarantees success, understanding how to properly use a blend of them can greatly improve your trading decisions. However, used incorrectly, they can be devastating to a traders’ performance.
This blog post covers some of the most widely-used forex indicators and how each of them can enhance your forex trading strategy; Moving Averages (MAs), RSI, Bollinger Bands, MACD, and Fibonacci retracements and extensions.
- Introduction
- Moving Averages
- Relative Strength Index (RSI)
- Bollinger Bands
- MACD (Moving Average Convergence Divergence)
- Fibonacci Retracement
- Using and Combining Indicators Effectively
- Pros and Cons of Indicators
- Conclusion
Moving Averages (MAs) are used to identify trends and smooth out price action. Two common types include:
Simple Moving Average (SMA): Average prices over a specified period, giving equal weight to each data point.
Exponential Moving Average (EMA): Gives more weight to recent prices, making it more responsive to price changes.
Moving averages trading helps determine overall trend direction, but can also be used as support and resistance.
The 50-day and 100-day simple moving averages are widely used by traders around the world. As a rule of thumb, the wide the delta between two moving averages, the stronger the trend, as shown in Figure 1 below.
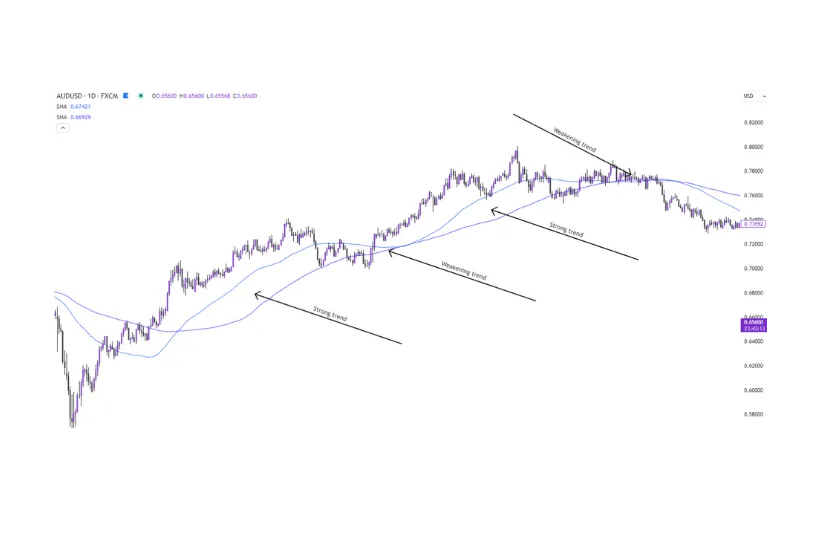
Figure 1 – Examples of a strong and weakening trend using the 50sma and 100sma.
Another commonly-used moving average is the 200-day SMA. When combined with the 50-day moving average, traders keep a close eye out for a ‘Golden Cross’, or ‘Death Cross’, when the 50sma crosses above, or below the 200sma. This pattern has a history of identifying a possible reversal after a strong trend.
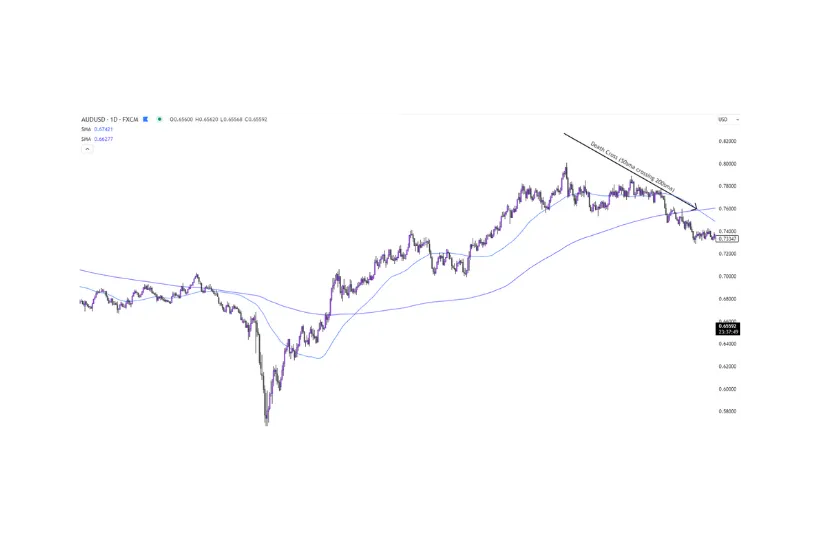
Figure 2a – example of a ‘Death Cross’ on the AUDUSD daily chart.
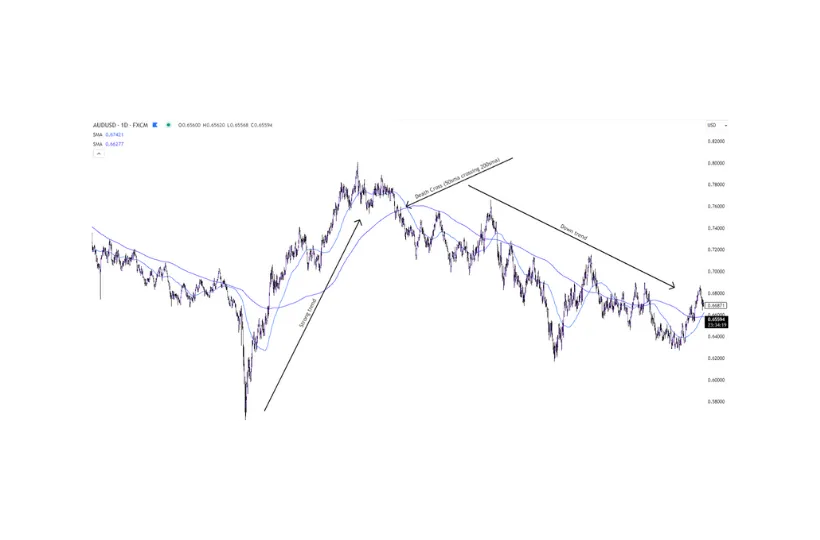
Figure 2b – the resulting change in trend direction.
Some traders use MAs as support and resistance levels for entering, and exiting trades. This method works on all timeframes but is most commonly used for intraday trading. For example, Figure 3 highlights a number of support and resistance points using the 50, 100, and 200 SMA’s on the 15min chart of EURUSD;
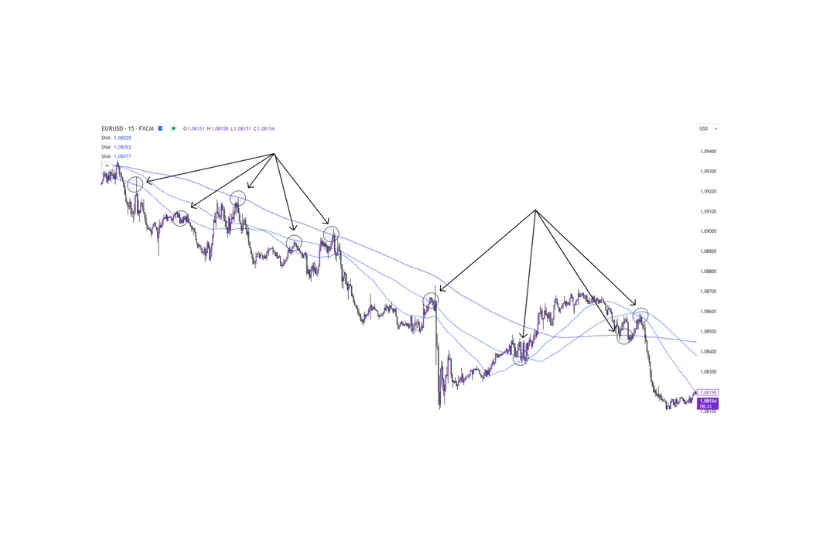
Figure 3 – Support and resistance using 50, 100, & 200sma on a 15min EURUSD chart.
The Relative Strength Index (RSI) is a momentum oscillator that measures the speed and change of price movements. It ranges from 0 to 100, providing insight into whether an asset is overbought or oversold.
Using RSI to identify overbought and oversold extremities:
- Overbought (70+): Indicates that an asset may be overvalued and could be vulnerable to a pullback.
- Oversold (30 or below): Suggests that an asset may be undervalued, potentially leading to a price rebound.
Additionally, divergence occurs when the price and RSI move in opposite directions, signalling a potential reversal. For example, if the price makes a new high but the RSI does not, this “bearish divergence” may suggest a decline, as shown in Figure 4 below.
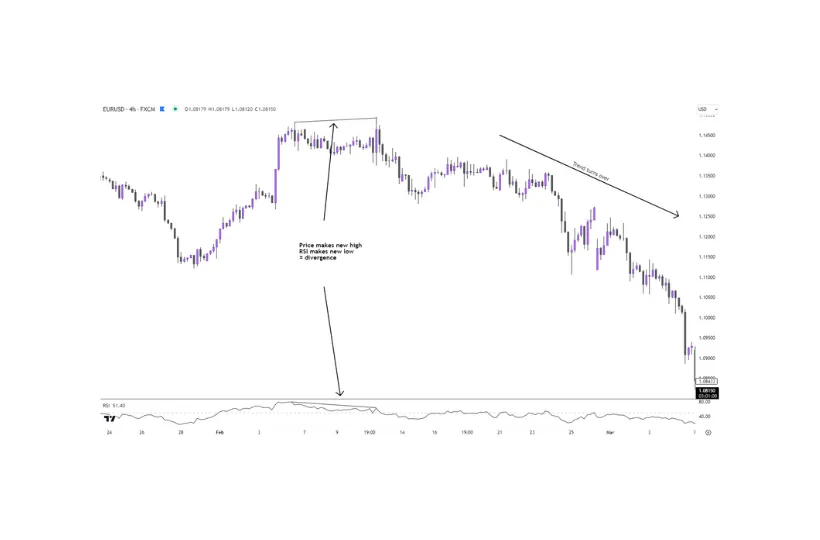
Figure 4 – RSI divergence on EURUSD 4-hour chart.
This method of analysis is heavily relied on by pattern and reversal traders. However, it’s important to note that the lower the timeframe you trade on, the more ‘false’ divergence signals you will encounter, thus making this method of analysis more suitable for longer-term swing traders.
Bollinger Bands consist of a middle SMA line with two outer bands representing standard deviations from this average, creating a channel around price action. The width of the bands indicates market volatility.
Bollinger Bands Strategy for Breakouts and Squeezes:
- Breakout Trading: Price moving beyond the upper or lower band can signal a strong directional move.
- The Squeeze: When the bands contract, it indicates low volatility and a potential breakout in either direction. Traders can prepare for a price move when bands begin to widen after a squeeze.
Figure 5 below shows an example of the contraction (“The Squeeze”), followed by an explosive move upward.
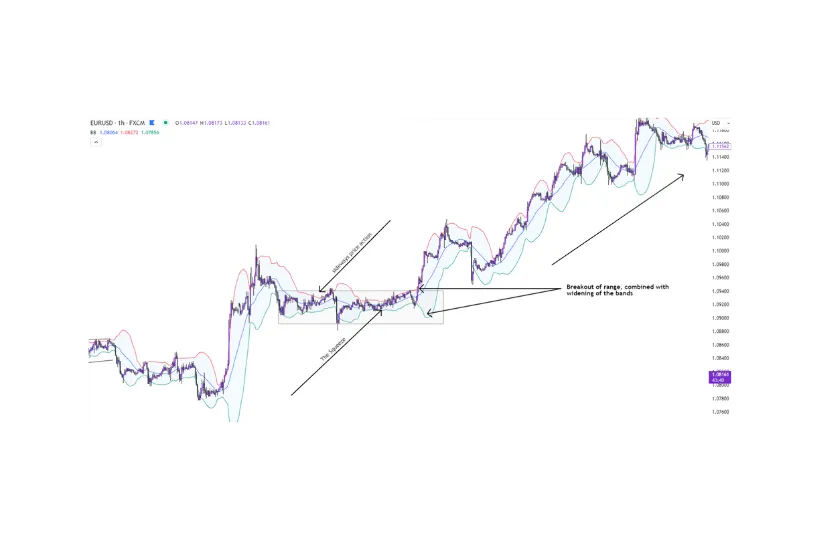
Figure 5 – Breakout trade on 1-hour EURUSD chart using The Squeeze method.
Bollinger bands are typically used with default settings, however, some traders may edit the settings to adapt the indicator to be more closely aligned with their trading stye/strategy.
MACD is a trend-following momentum indicator that displays the relationship between two moving averages (commonly the 12-day EMA and 26-day EMA).
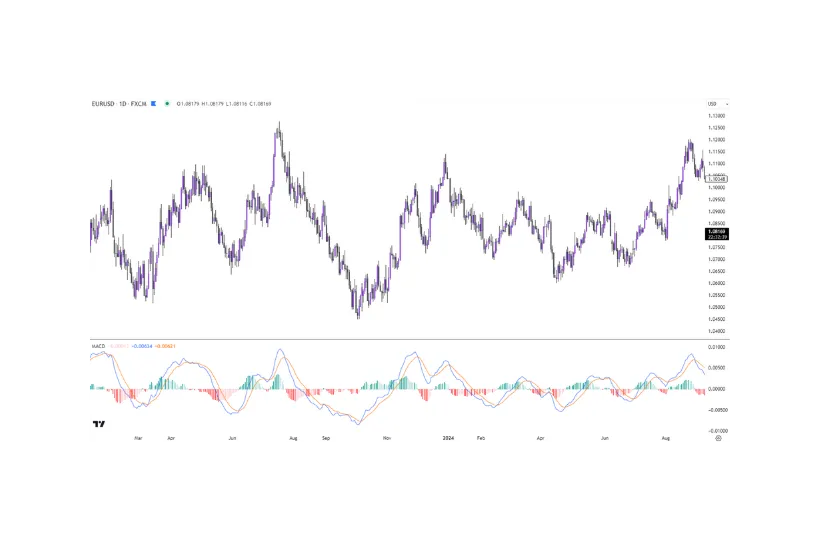
Figure 6 – MACD indicator applied to EURUSD daily chart.
The MACD indicator comprises of:
- Fast line: The difference between the two MAs (blue).
- Slow line: Signal line, which is a 9-day EMA of the MACD line (yellow).
- Histogram: Represents the difference between the MACD and the signal line.
There are many ways to use the MACD in trading. The most common of which, is to identify the end of a trend.
Interpreting MACD crossovers for trend exhaustion:
- Bullish Reversal: The two moving averages are below the zero line, the fast (blue), crosses the slow (yellow) to the upside, and the histogram turns bullish (green).
- Bearish Reversal: The two moving averages are above the zero line, the fast (blue), crosses the slow (yellow) to the downside, and the histogram turns bearish (red).
MACD is often used on higher timeframes to determine whether a current trend is showing signs of exhaustion. In doing so, traders can identify profit-points and/or opportunities for reversal trades.
Fibonacci retracement levels are horizontal lines drawn at specific price points that can act as potential support and resistance levels. These levels are derived from the Fibonacci sequence and include 23.6%, 38.2%, 50%, 61.8%, and 78.6%.
How to Use Fibonacci Retracement: Identify a significant peak and trough in the price chart, then draw the retracement lines to determine possible areas of reversal. Many traders use Fibonacci levels to predict areas where pullbacks might end, providing opportunities to enter trades in the direction of the main trend, as shown in Figure 7 below.
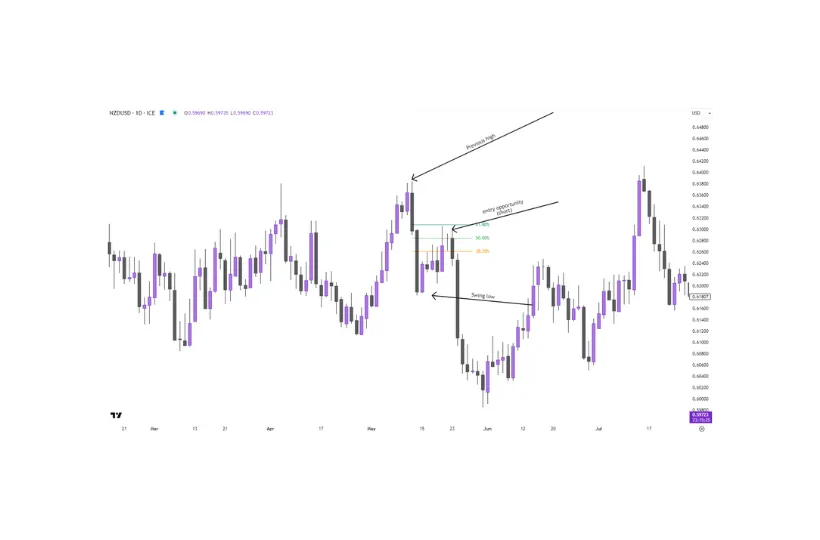
Figure 7 – Example of using Fibonacci retracements for trade entry.
As shown in Figure 7, the Fibonacci tool is drawn from the previous high, to the previous low. In this example, we’ve used the most common retracement levels – 38.2%, 50%, and 61.8%.
Fibonacci levels are effective on all timeframes and work extremely well in conjunction with other technical analysis indicators.
Whilst each indicator provides valuable insights, using multiple indicators can prevent produce more reliable signals. Here are some practical tips:
- Avoid clutter: Using similar indicators (e.g., two momentum indicators) may clutter charts without adding any significant value.
- Complementary combinations: For example, combining RSI with MACD can offer insights into both trend strength and momentum. Additionally, pairing Bollinger Bands with Moving Averages can highlight breakout opportunities and trend directions.
- Multiple timeframes: Balancing indicators across different timeframes allows you to gauge the broader trend while identifying precise entry and exit points.
Every technical analysis indicator has its own strengths and weaknesses, so what might work for one trader, might not work for another
Here are some Pros and Cons of the indicators we’ve discussed in this blog post;
Moving Averages
- Pros:
- Smooths trends
- Acts as dynamic support/resistance
- Versatile across different timeframes
- Cons
- Lags in fast-moving markets
- Prone to false signals
- Often requires confirmation from other tools
Relative Strength Index (RSI)
- Pros:
- Identifies overbought and oversold conditions
- Provides divergence signals
- Simple to learn and interpret
- Cons
- Can generate false signals
- Limited effectiveness in ranging markets
- May stay in overbought or oversold zones for extended periods
Bollinger Bands
- Pros:
- Measures market volatility
- Provides breakout signals
- Makes spotting volatility easy
- Cons
- Can be complex to interpret
- Prone to false signals
- Does not provide clear directional information
MACD (Moving Average Convergence Divergence)
- Pros:
- Combines trend and momentum analysis
- Generates clear crossover signals
- Histogram visually represents momentum changes
- Cons
- Lagging indicator
- Less effective in sideways markets
- Can produce false signals
Fibonacci Retracements
- Pros:
- Highlights natural support and resistance levels
- Works well in conjunction with other indicators
- Useful in trending markets
- Cons
- Placement of levels can be subjective
- Often requires confirmation from other tools
- Not all price pullbacks respect Fibonacci levels
We strongly recommend looking into all the different technical analysis tools and forex indicators available, find the ones that ‘make sense’ to you, and research into how they are calculated and how they were intended to be used. From there, you can adapt the settings as needed to fit your trading style and strategy.
Incorporating the right indicators, whether it’s Moving Averages, RSI, Bollinger Bands, MACD, Fibonacci retracement, or other, can provide a more comprehensive view of market conditions, allowing you to become more confident in your analysis.
Remember, whilst indicators offer insights, they are most effective when personalised to fit your strategy and continuously practiced. So, experiment with these tools, find what works best for you, and let your trading skills evolve.
Ready to get started? Open an account with us.
Remember: Successful forex trading requires a balance of economic insight, technical skill, and disciplined risk management. Stay informed, practise consistently, and adapt your strategies to ever-changing market conditions.
We’ll never share your email with third-parties. Opt-out anytime.