Trading in a Recession
Volatility is opportunity and there is no better time to embrace volatility than in a recession. To improve your success trading in a recession we’ve compiled a short list that will cover the historical performance of different asset classes, a look into different recessions, and strategies that could be implemented during a downturn.
- Know your markets
Forex
Stocks
Commodities
Cryptocurrencies - Know your recession and recession history
Global Financial Crisis
Covid-19 - Strategies
What is a Recession?
Before we dive further into the markets and strategies, let’s first understand the broad strokes of a recession and what it really means.
The term “recession” is generally applied when two consecutive quarters of negative GDP growth are reported, dubbed a “technical recession.” However, this can often be myopic and not encapsulate the entire economic environment. Unemployment, consumer spending, and lending accessibility are just some of the other indicators that help convey when an actual recession has occurred. Overall, there should be a general decline in overall economic activity.
In the US, the National Bureau of Economic Research (NBER) is the authority in determining a recession. They define it as: “a significant decline in economic activity that is spread across the economy and that lasts more than a few months.” [1] Therefore despite the US reporting two negative quarters of growth in 2022, the Whitehouse issued a blog stating they are, in fact, not in a recession.
Regardless, when you see a general decline in economic activity, being prepared and able to adapt your strategy on the fly will largely determine your success as a trader when market conditions change.
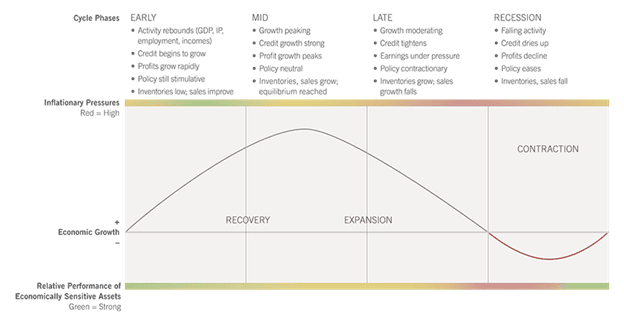
Overview of Business Cycle Phases (Source)
So what does this means for the markets?
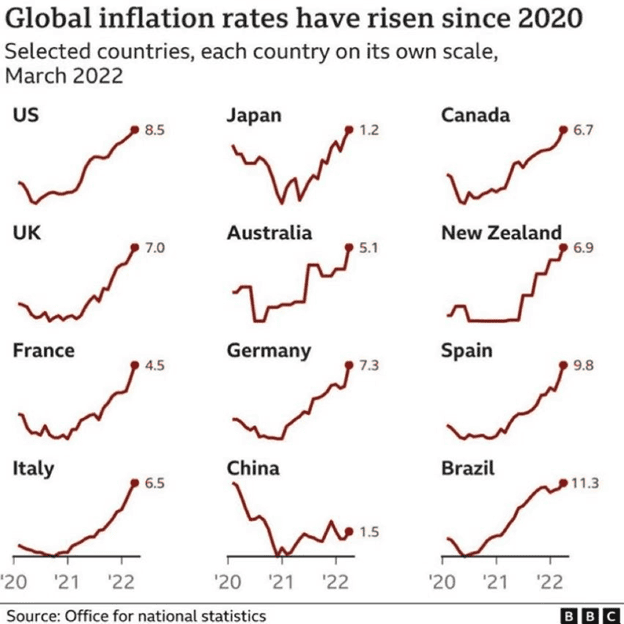
Most know that in recession-like conditions, people become more risk-averse. We’ve seen this all throughout 2022. Risk-on assets like crypto, high-growth tech stocks, and speculative assets plummet, and safe havens currencies and assets rise.
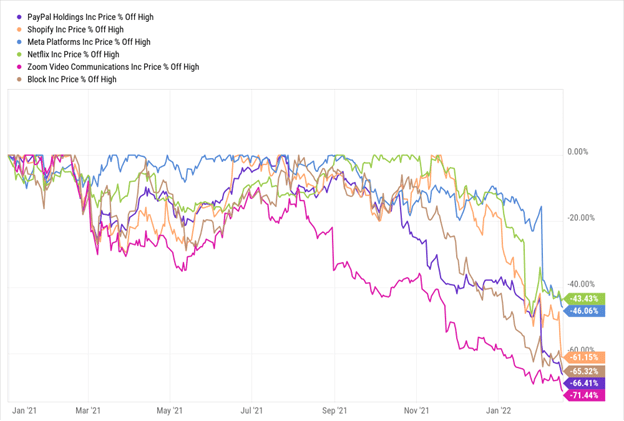
Selected Tech Stock Declines, Jan 2021 – Feb 2022
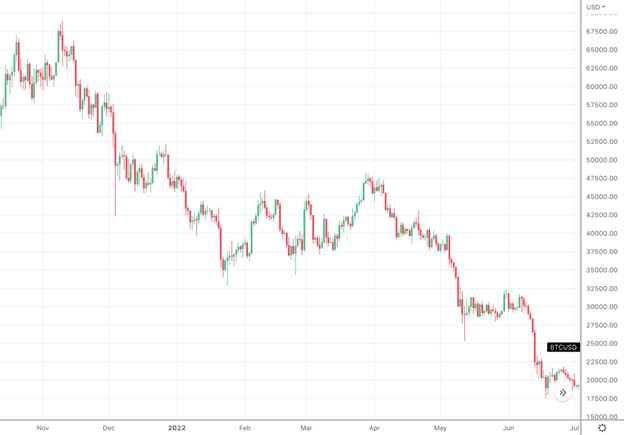
BTC/USD Oct 2021 - July 2022
In terms of forex, we’ll find that the demand for a currency will still largely be determined by the economic state of the issuing country/region. We’ll see strong economies and trusted currencies that the market believes can weather a recession rise or remain stable, and economies that are more susceptible to a severe fallout decline.
Know Your Markets
Most traders will not trade every market, so the first thing to understand in a recession is how your asset class has historically acted in an economic downturn. We all know that past performance is not an indication of future performance, but as the saying goes, “history doesn’t repeat, but it often rhymes,” so let’s first look at how different asset classes have historically performed.
Know your markets: Forex
Forex is not like other asset classes. Forex is to an economy as oil is to a car engine. It keeps the engine functioning but is not necessarily the gas that makes it go. Unlike an overall stock crash, in a recession we’ll see certain currencies shine. The main thing to look at is a country’s strength in a recession and how much it is seen as a “safe haven”.
For example, in the first half of 2022, as recession fears were reaching a fever-pitch, we saw great strength in the USD. This is because most traders have greater trust in the US Dollar and confidence in the US economy, despite the US experiencing severe inflation and stagflation concerns.
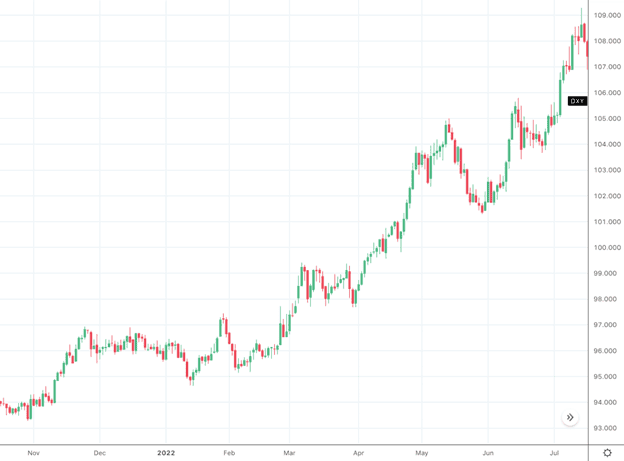
DXY Oct 2021 - Jul 2022
Similarly, you’ll likely see emerging market currencies crash in a global recession as they are more vulnerable to economic downturns. This is further backed up by JP Morgan, who calculated that emerging market currencies drop by an average of 17% over a two-year period from the start of a recession. [2] Even G10 countries can be affected, as JP Morgan also estimated that the New Zealand dollar loses 7-8% in times of a recession.
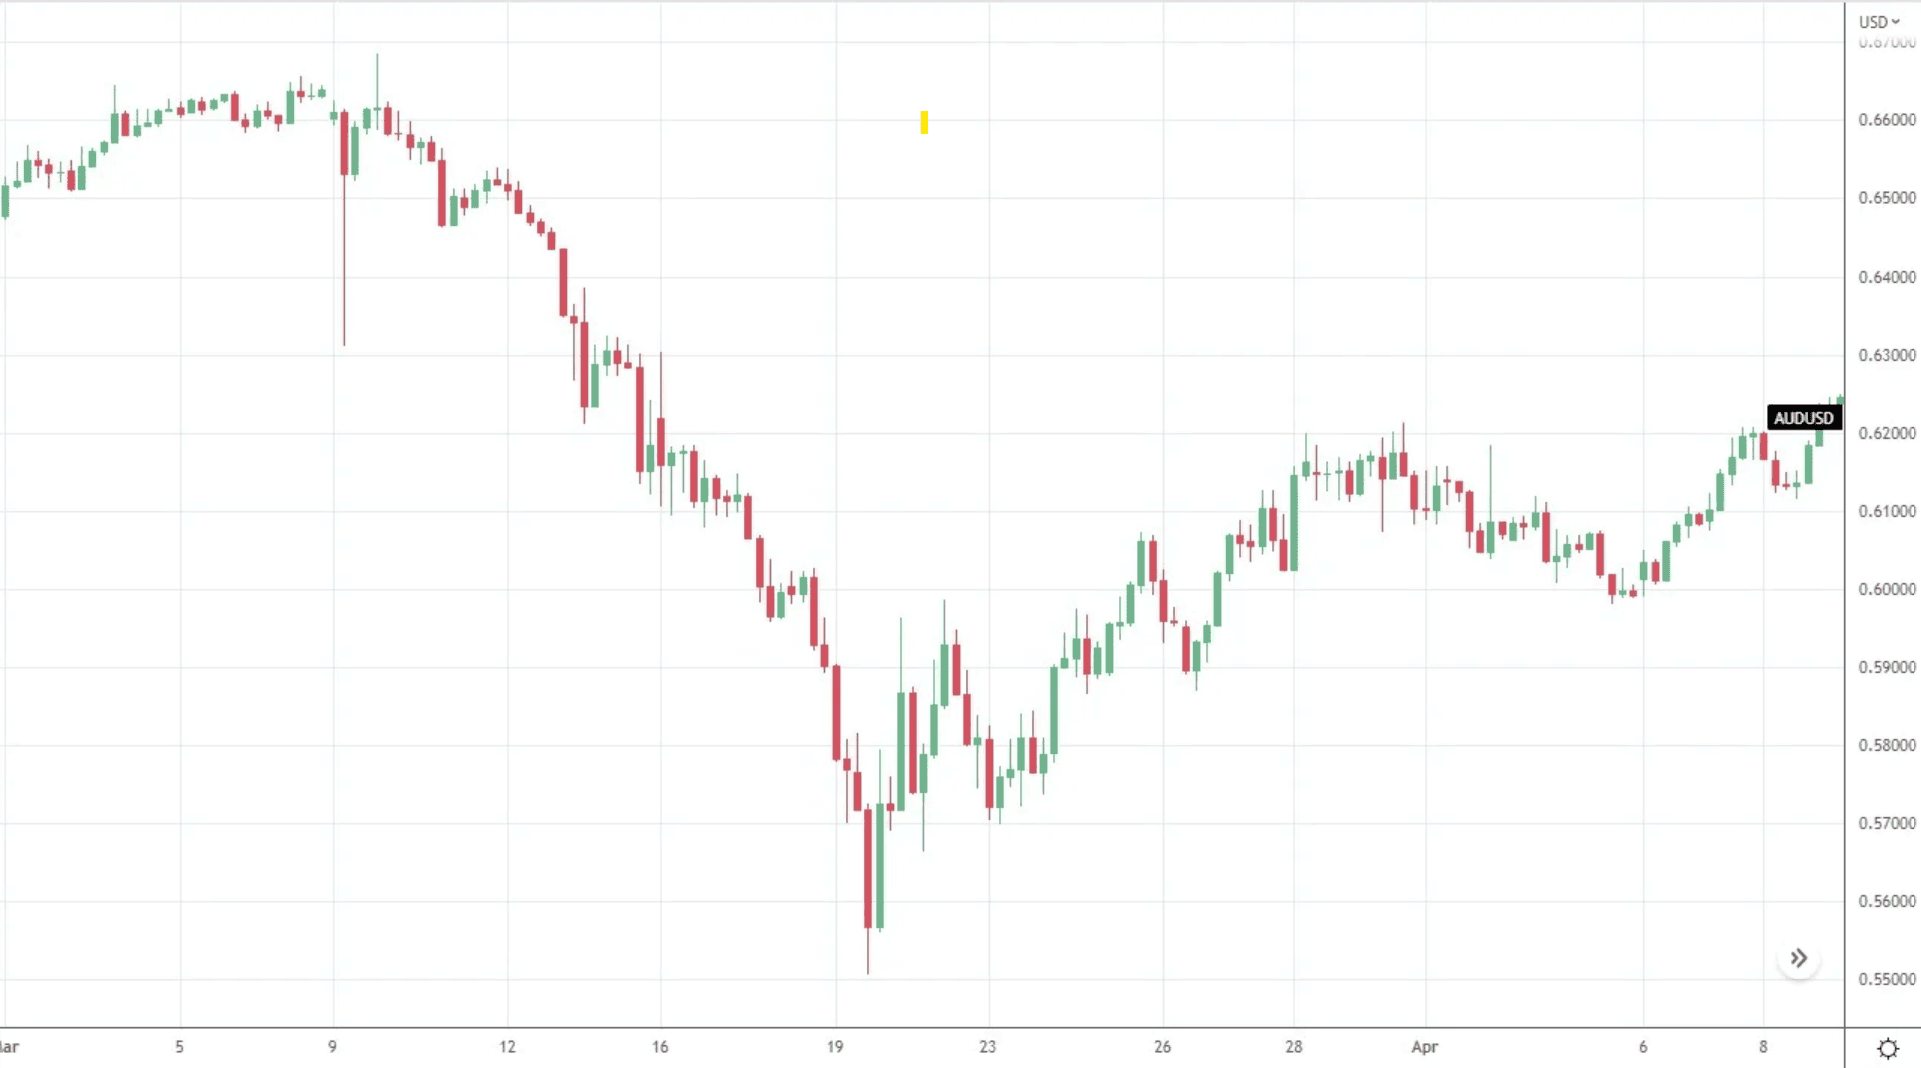
AUD/USD collapse during COVID recession (March 2020)
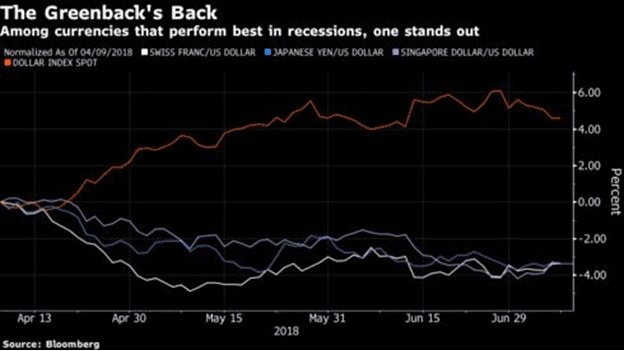
In terms of the strongest currencies, these have traditionally been:
- US Dollar
- Swiss Franc
- Japanese Yen
- Singapore Dollar
Putting a particular spotlight on the US dollar, as the world’s default currency, we’ll often find banks buy USD when they (and companies) deleverage. We saw this already in the DXY when recession fears were very much at the forefront of the market’s mind both in 2022 and 2008.
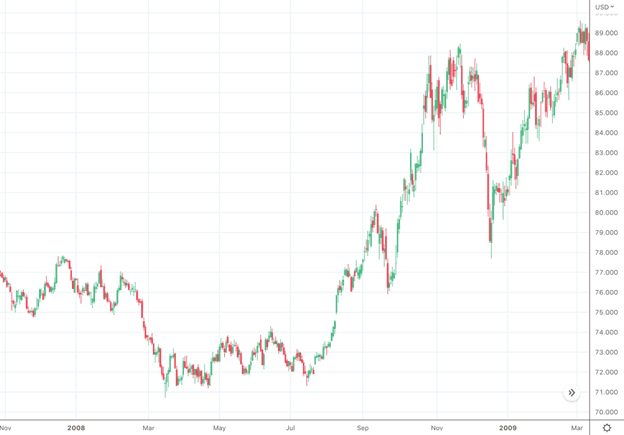
DXY Nov 2008 – Mar 2009
It’s important to note that these are broad generalisations. Each recession will have its own intricacies and market movements. At the end of the day, macroeconomic data is still king and will trump any broad-stroke generalisation. Indicators and future forecasts of metrics like balance of trade (imports/exports), currency demand, employment figures, inflation, spending behaviour, and monetary policy will all have significant effects on the strength of an economy and subsequently its currency. Remember to keep up to date will the latest news, forecasts, and figures. One way to do this is by visiting Fusion Markets’ economic calendar.
For instance, we saw weeks before that energy prices were coming down due to a number of factors (Libya’s lifted embargo, OPEC+ meetings, lower demand, etc.) - energy was a major factor in the US’s rising CPI in 2022. This combined with the Fed’s less hawkish stance on rate hikes, positive job numbers, and slowing inflation saw markets rally and embrace a higher risk appetite, further exemplified by the fall of the DXY.
Know your markets: Stocks
Overall, we’ll generally see indices crash in a downturn. This year we saw the S&P500 fall below the 20% threshold that stock traders use to determine a “bear market”. Similarly, from 2007-2008, we saw the S&P 500 fall from 1,527 (Sept. 2007) to 968 (Sept. 2008) and the FTSE 100 drop from 6466 to 4902 over the same period.
That being said, not all stocks will plummet. While “growth” stocks will be hit the hardest, you’ll notice that “defensive stocks” may actually rise during this time. For example, McDonald’s Stock rose 5.8% in Sept 2007 to Sept 2008. Similarly, we saw Coca-Cola increase revenues by 12% quarter on quarter in 2022 Q2.
Fidelity created a template (below) that outlines a rough guide of how different sectors perform at different stages of the business cycle.
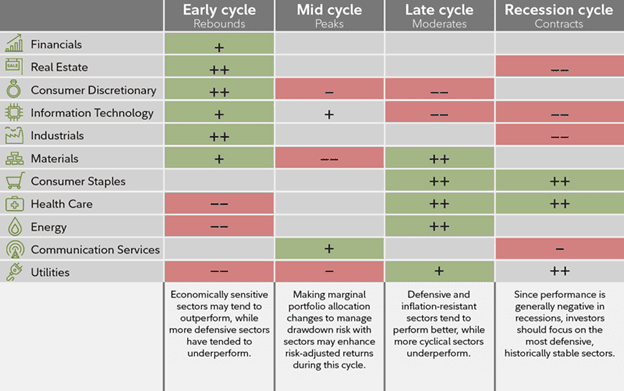
Fidelity’s Sector Rotation Chart (Source)
Know your markets: Commodities
Obviously, gold is seen as a safe haven to many, especially during a recession and historically has thrived in risk-off conditions. However, gold is not the only commodity that may see gains. Similar to stocks where staple companies rise, we often see other popular commodities used when times are tough such as corn and wheat also rise. Reversing this assessment, we’ll also find commodities in high demand in booming economic conditions like those used in infrastructure, such as copper, fall.
Similar to stocks and forex, these are all broad strokes and real-time data will trump generalisations. Ask yourself questions about how commodity markets will be affected in an economic downturn such as: are there political hold-ups (sanctions, embargoes)? How will the supply chain look (what could reduce/increase supply)? Does the commodity have new uses/markets (e.g. EVs)?
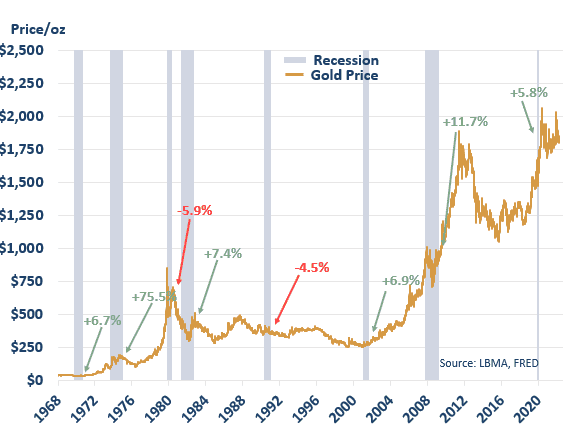
Gold Price vs Recessionary Period 1968 - 2021
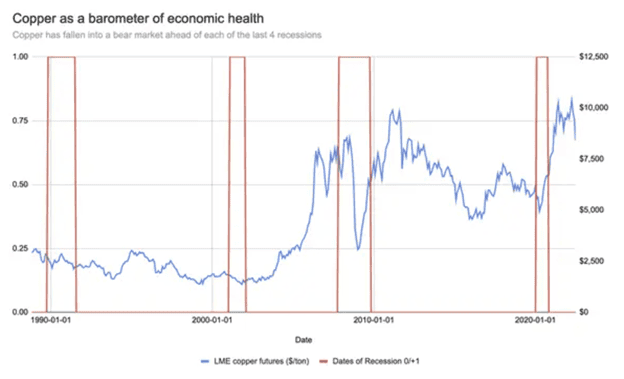
LME Copper Future price vs Recessionary Period 1990 - 2020
Know your markets: Crypto
Crypto has not been around in a recession, so it can be difficult to determine how it will react in such conditions. However, it has been through several bear markets that can paint a telling picture of how the market behaves in a downturn.
Obviously, crypto is in the basket of “risk-on” assets, so you’ll generally see falls across the board, even in deflationary crypto assets. The real question is, what kind of falls will you see?
Historically, Bitcoin has been the gold standard and although it has dropped significantly in bear markets its crash has been less severe than altcoins (alternative coins) like Doge, Ada, and Stellar. Ethereum is also now considered a bluechip coin and may show the same resilience in an upcoming recession, but in the last bear market (2018 - 2020), it followed the same big crash blueprint of other altcoins, coming down from $1,396 USD to $84 at the bottom of the market.
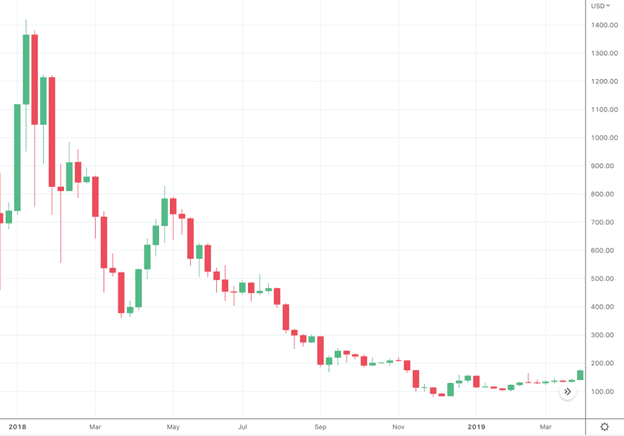
ETH/USD December 2018 – March 2019
The other key factor you’ll need to consider is which altcoins have staying power. While it’s true Bitcoin will hold up better in a market downturn than altcoins, it is also true that Bitcoin will have less upside than altcoins that are able to survive through a bear market. In 2020-2021, altcoins that weathered the bear market (Ethereum included) saw mind-boggling rises that dwarfed the return of bitcoin.
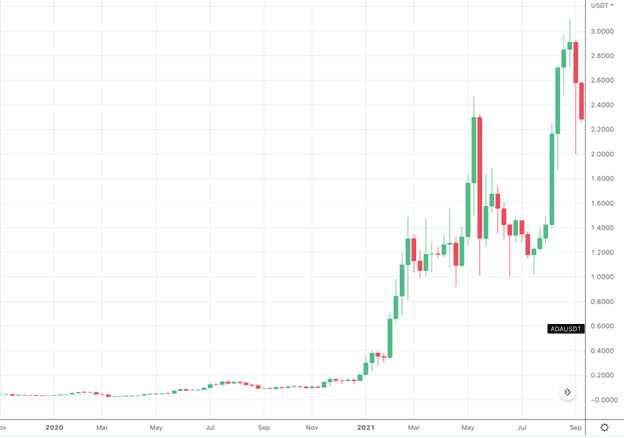
ADA/USD Nov 2020 - Sep 2021
At the end of the day, it comes down to your risk appetite, your time horizons and your trading style.
Know your history and recession
What kind of recession is this and what policies are central banks enacting to soften the blow? If we look throughout history, we’ll see a variety of different recessions with varying lengths, severities and outcomes. So, while it’s important to know how asset classes generally respond, it’s also very important to know what is unique about the recession you’re experiencing.
Let’s examine two past recessions.
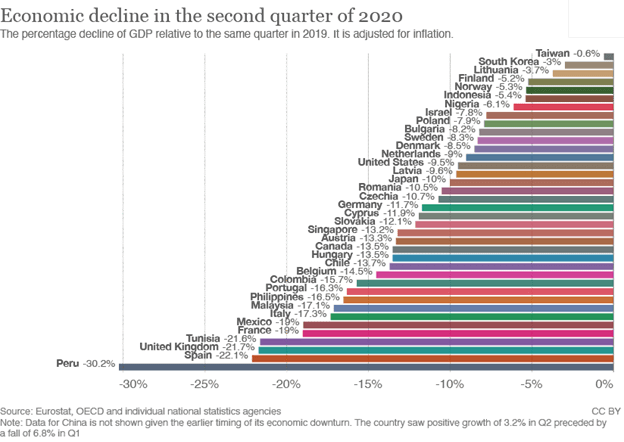
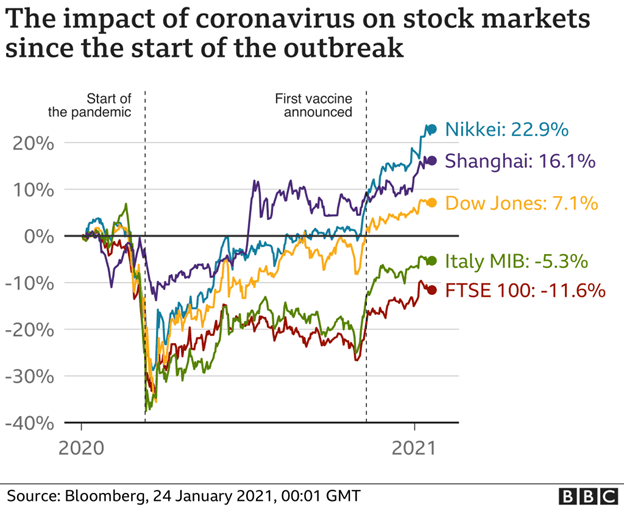
Covid-19 Recession (March 2020)
The Covid-19 recession was unlike many recessions of the past due to the unique effects on supply chain, employment and the unprecedented QE response from central banks. While the markets had been on a significant bull run for some time, the downturn can only be described as abrupt and violent.
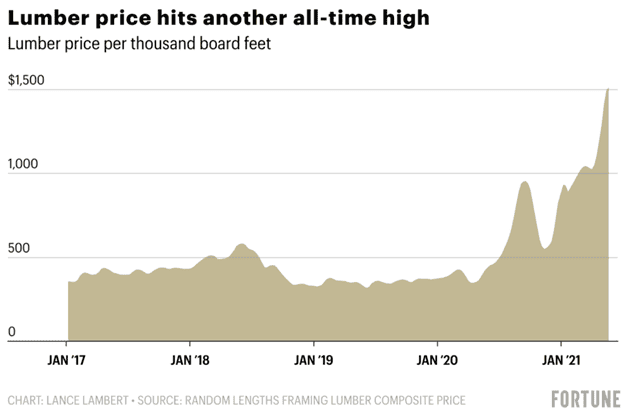
Following, central banks went into action and put the jets on stimulus and other economic incentives to keep their economy afloat. As a result, we saw unprecedented growth across risk-on assets, and assets affected by supply chain issues such as corn and timber.
Central banks’ response also saw further economic hardships appear as inflation rose significantly, further affecting economic stability and has led to what many are predicting as a long, hard crash in the next recession.
Take Aways:
- Central Bank responses are paramount
- Look beyond the term “recession” - what are the actual aftermath effects of the recession-cause (e.g. lockdowns, supply restrictions, who stays employed)?
- How has previous market behaviour affected investor expectations and risk appetite (prior long-lasting bull market)?
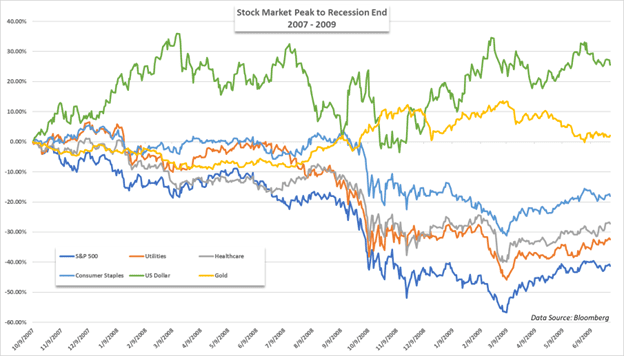
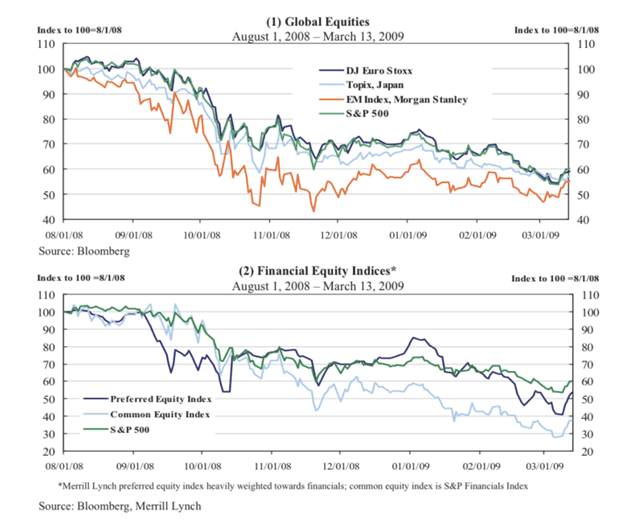
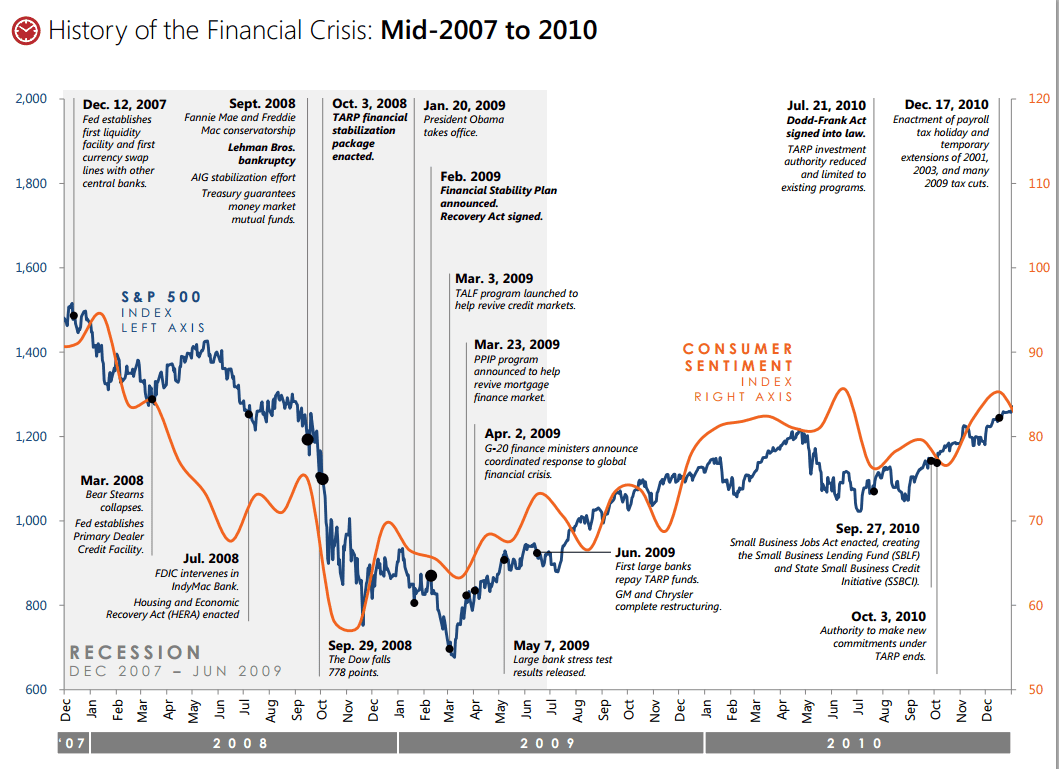
Great Financial Crisis/Great Recession (Dec 2007 - June 2009)
The Great Financial Crisis (GFC) was a severe recession that affected economies across the globe. It was largely driven by financial deregulation in the US (repeal of Glass-Steagall) that allowed risky subprime lending and securitisation of toxic assets. As a result of the overheated mortgage-backed securities market, when the economy started to slow in 2007 it set off a chain of events that created chaos throughout the global markets, leading to global credit freezes.
During this time the S&P500 fell 38.49% in 2008 (its worst year since 1937). In order to prevent a depression, governments began implementing quantitative easing (QE) policies, as well as a number of other measures to prevent further economic catastrophe. However, it still took roughly 4-5 years for the markets to fully recover. Similar to today, in the FX markets we saw USD act as a safe haven.
Notable price market movements in 2008:
- DJIA -33.84%
- S&P500 -38.49%
- Gold Rallied +8.29%
- Oil plunged -53.5%
Take Aways:
- How does the recession affect lending?
- How did it affect consumer confidence?
- To what extent will central banks go to avoid severe downturns (bailouts, QE, etc.)?
Embrace your strategy
While you will be adapting your strategy in a recession, it’s still important to stick to your trading plan. Know your take profit levels, know your stop loss levels and know your time horizon.
Are you an intraday trader or a swing trader? Can your strategy in a bull market be applied in a bear market with tweaks? Has your risk appetite changed?
Let’s examine a couple of common CFD trading strategies:
Hedging
Hedging is the trading strategy of mitigating your risk by taking an opposite position in the asset or related asset. As many people are often long-term stock investors, some traders may wish to offset their risk by taking an opposite position in stocks or indices. If you’re looking for a cost-effective way to implement this strategy you can use Fusion Market’s commission-free US Share CFD or Equity Indices trading.
Position Trading
As you will know the market you’re trading (FX, Equities, Commodities, Crypto etc.), you’ll also have some rough ideas of where particular assets may move. Position trading is akin to buy and hold or sell and hold strategies. In that, you take a position and run with it until you hit your broader take profit or stop loss levels.
Scalping
Scalping is the practice of buying and selling an asset quickly with the aim of making small and quick profits. It is often favoured by day traders. There are many scalping techniques with some even considering arbitrage as a form of scalping. Others may try to briefly catch a trend, while some traders may look to trade the asset when it is “ranging” (bouncing between clear support and resistance levels).
Carry Trading
Carry trading is profiting from interest rate spreads between two currencies by borrowing in a currency with a low-interest rate and converting that to a currency with a higher interest rate. This is a popular strategy among forex traders. However, this strategy carries risks such as the currency pair you are carry trading substantially drops in value. This is why it’s important to know the latest macroeconomic data to ensure your loaned asset doesn’t break in the wrong direction.
News Trading
This can be especially potent in an economic downturn as traders will be closely watching central banks and will react quickly to their decisions. For example, as inflation and recession fears were major concerns in 2022, central bank interest rate hikes had significant effects on the markets and the perceived economic outlook of a country. This type of trading can be both short or long-term, but to be successful you’ll need to know what the market already thinks. A common method for this is to look at futures data and other markets to gauge expectations. For example, you can see data on Fed fund rate futures to see what interest rate hikes the market expects from the Fed. How closely the Fed matches expectations will affect how the market moves on and after their announcement.
These strategies, much like other information in this article are broad ideas, nothing is to be taken as gospel. Still, it is a useful way to get a better grasp of what happens in a recession and how to position yourself to remain profitable when the market falls.
Let us know what you think and if you have any other things you believe we should have added.
To be able to trade all your assets in one place with the lowest commissions forex broker, join Fusion Markets today and get access to over 250+ trading assets. With 37ms* executions and from 0.0 spreads, we’ve made trading easy.
We’ll never share your email with third-parties. Opt-out anytime.