Loading...
No results

Understanding Different Types of Trading Accounts

Fusion Markets

post content image

Trading accounts serve as the cornerstone of the trading journey, providing individuals access to financial markets where they can buy and sell various assets. These accounts not only facilitate trading activities but also play a crucial role in managing funds, tracking performance, and executing strategies.  


However, with numerous options available, selecting the right trading account can be daunting, especially for novice traders. In this guide, we'll unravel the intricacies of trading accounts, compare demo accounts with live ones (Zero | Classic), explore different types of live trading accounts, and offer guidance on choosing the most suitable account type based on individual needs and goals. 


Contents


Demo vs. Live Accounts


Before diving into the complexities of live trading accounts, it's essential to understand the distinction between demo accounts and live accounts.
 

Demo accounts, also known as paper trading accounts, provide a simulated environment for practice. They allow traders to test trading strategies, familiarise themselves with platform features, and observe market dynamics. These accounts use virtual money, eliminating financial risk. However, they have limitations: trades aren't executed in real markets, potentially causing time and price discrepancies, and large orders can be filled at unrealistic prices due to artificial liquidity.
 

While demo accounts offer a risk-free way to gain trading experience, they lack the emotional involvement and psychological challenges present in live trading. This can often become a problem for new traders as they results they observe on a demo account may not be replicated on a live account. This is because risking your own hard-earned cash introduced a plethora of emotions that get in the way of you thinking clearly and making calculated decisions.


Transitioning from a demo account to a live one is a crucial step for aspiring traders. Live accounts involve real money, introducing emotions such as fear, greed, and anxiety into the trading equation. While demo accounts serve as valuable learning tools, they cannot replicate the psychological impact of trading with real funds. Therefore, transitioning to a live account is essential for traders to develop the discipline, emotional resilience, and decision-making skills necessary for success in the live market environment.

 

Demo v Live Accounts


Types of Live Trading Accounts


When it comes to live trading accounts, Fusion Markets offers a variety of options tailored to meet the diverse needs and preferences of traders. Let's explore the key features, advantages, and potential drawbacks of each type: 


Classic Account


The Classic account option caters to forex traders seeking a straightforward and convenient trading experience. Created with user comfort as a priority, there's no need to fret over commission calculations prior to each trade.  


We streamline the process by factoring in costs through spreads, eliminating the hassle of additional fees or complex computations.  


With the Classic account, what you see is precisely what you receive, delivering simplicity and peace of mind to traders. 
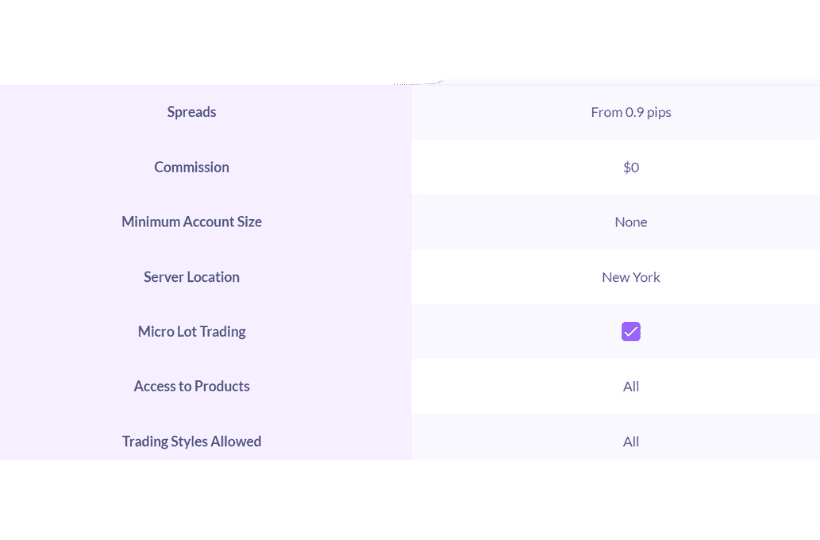
Classic Account

Learn more about our Classic account 


Zero Account


With a commission of $2.25 per side and spreads at 0.0, our Zero Account allows clients to engage in trading with raw spreads, offering a seamless and cost-effective trading experience. This account option appeals particularly to traders accustomed to managing their own commission calculations.


Ideal for active traders and scalpers seeking tight spreads and low trading costs.
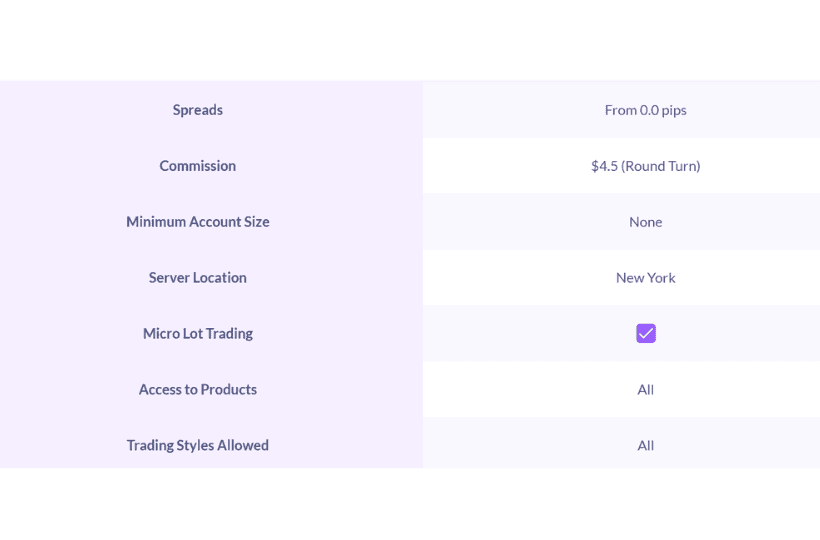
Zero Account

Learn more about our Zero account. 


Swap-Free Account


Tailored for traders adhering to religious beliefs prohibiting the receipt or payment of overnight swaps, our Swap-Free Accounts offer a no-interest solution.


Enjoy access to over 50 of the world’s leading financial instruments, including Forex Pairs and Indices, at our signature low rates.


Available across all account types, providing flexibility for traders with specific religious or cultural requirements.
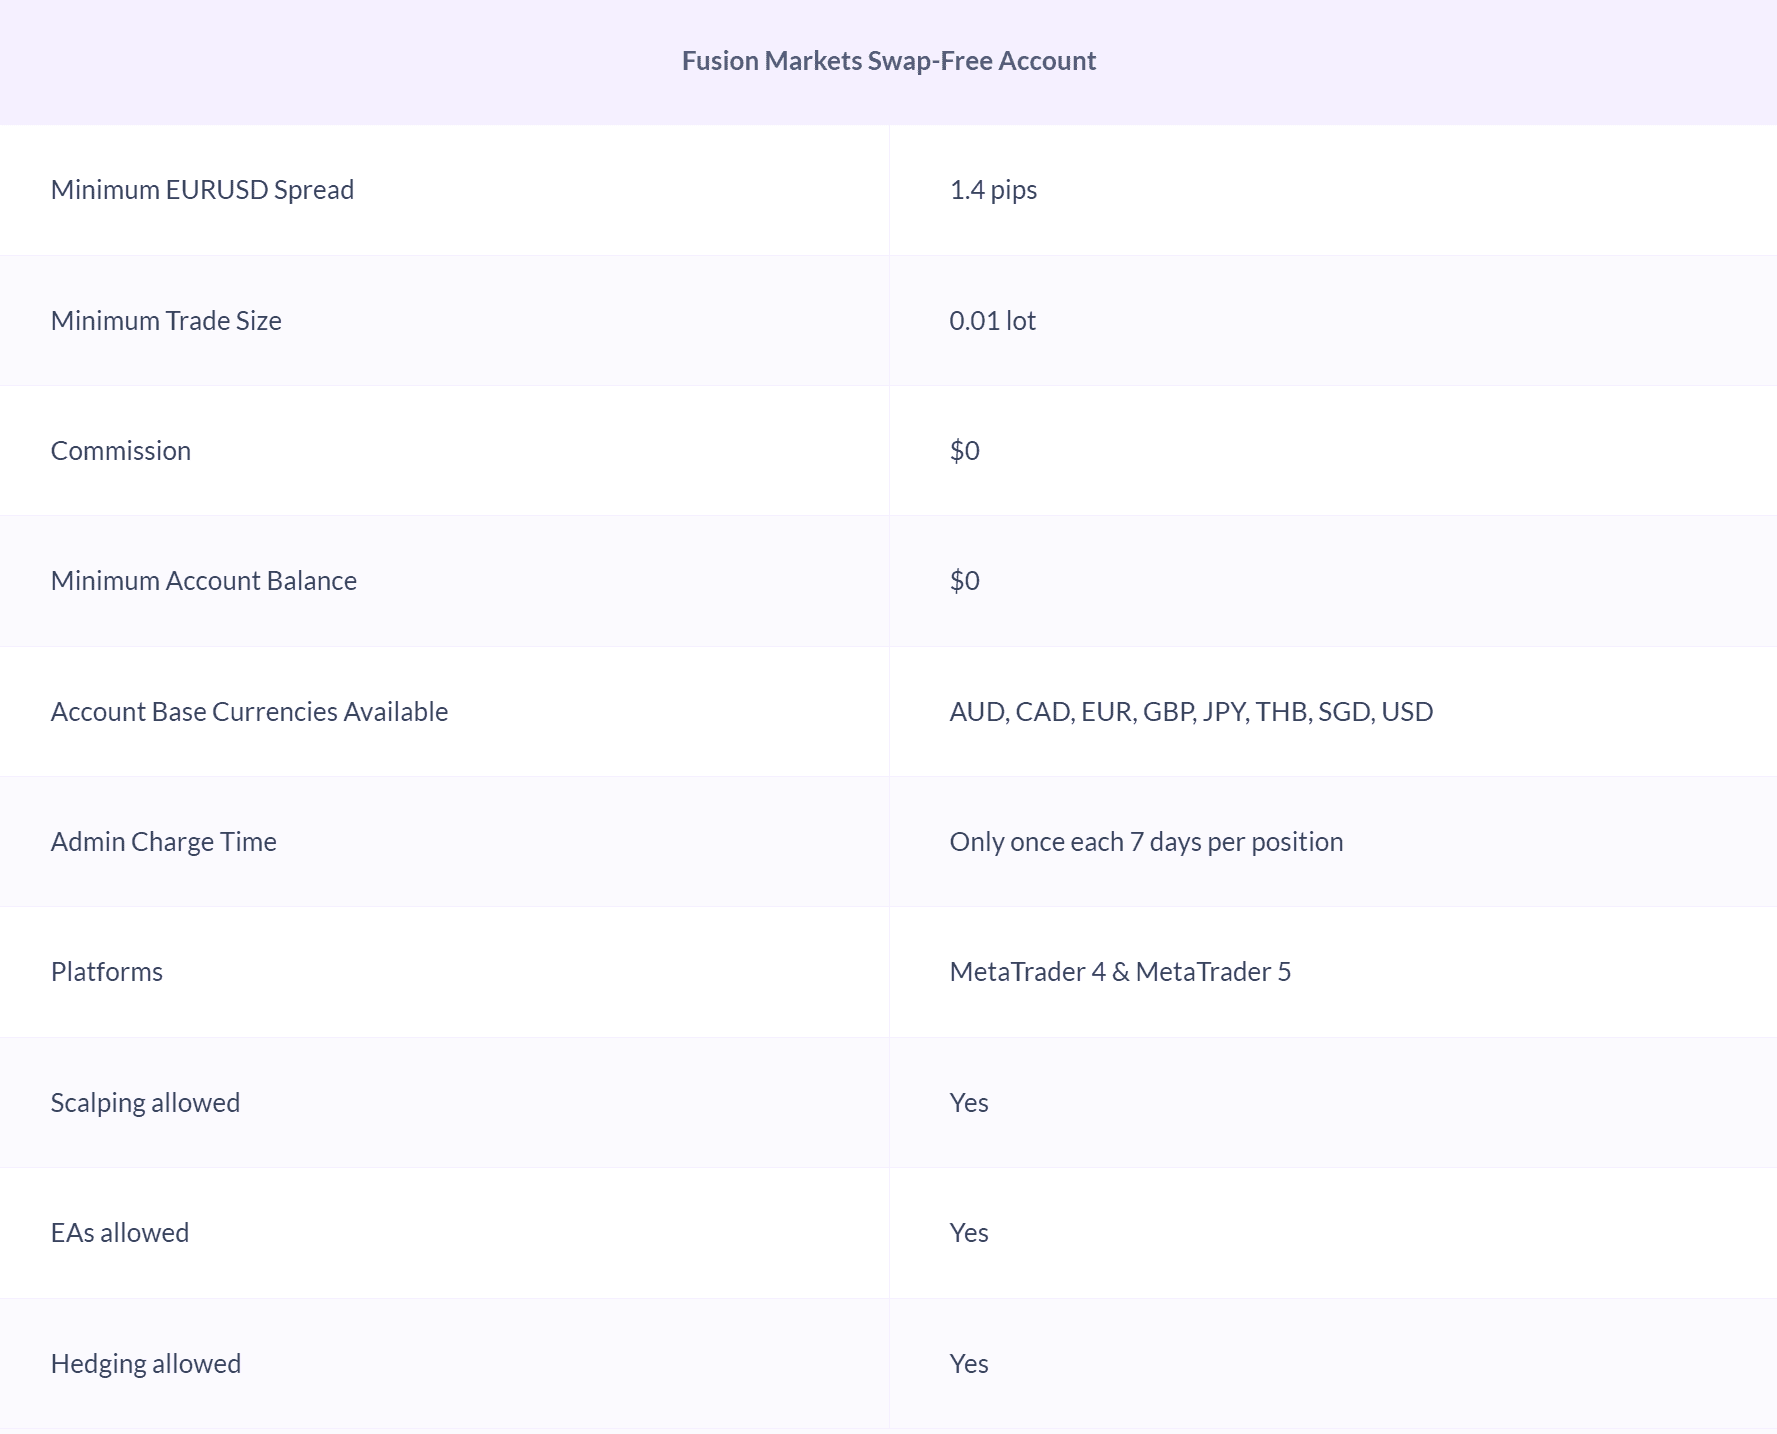

Swap Free 

Learn more about our Swap-Free account 


Factors to Consider When Choosing an Account


Selecting the right trading account involves careful consideration of various factors to ensure alignment with individual trading goals and preferences. Here are some essential considerations to keep in mind:


Risk Tolerance


Risk tolerance plays a pivotal role in determining the suitability of a forex account type for each trader. It reflects an individual's comfort level with market volatility, potential losses, and overall risk exposure.


When selecting a forex account type, it's crucial to align the account's features and trading conditions with your risk tolerance. For instance, traders with a low risk tolerance may prefer accounts with lower leverage, higher liquidity, and robust risk management features to minimise potential losses.


On the other hand, traders with a higher risk tolerance may opt for accounts with higher leverage and potentially higher returns, albeit with increased risk.


Trading Experience


Trading experience is a key factor to consider when selecting a forex account type as it directly influences a trader's comfort level, skill set, and familiarity with market dynamics.
 

Novice traders who are new to the forex market may prefer account types that offer simplified trading conditions, educational resources, and demo account options to practice and hone their skills without risking real capital.
 

Experienced traders with a deep understanding of market mechanics and proven trading strategies may seek advanced account types with features such as customisable leverage, access to advanced trading tools, and stop out levels. By aligning the account type with their trading experience, traders can optimise their trading environment to suit their knowledge level, maximise potential profits, and minimise the likelihood of costly mistakes.
 

Consider your level of trading experience and opt for an account that suits your skill level, whether you're a novice or seasoned trader.


Account Size and Leverage


Account size and leverage are critical factors to consider when selecting a forex account type, as they directly impact trading capital and risk exposure.

Traders with smaller account sizes may prefer account types that offer lower minimum deposit requirements and more conservative leverage options to manage risk effectively and preserve capital. Whereas traders with larger account sizes may have more flexibility in choosing account types with higher leverage options, allowing them to maximise potential returns while maintaining prudent risk management practices.

Additionally, traders with varying risk preferences may opt for account types that offer customisable leverage settings to align with their risk tolerance and trading strategies. By carefully evaluating account size and leverage options, traders can tailor their trading environment to suit their individual risk preferences, capital constraints, and long-term financial goals. All Fusion accounts have no minimum account size requirements, providing flexibility for traders of all sizes.


Cost of Trading


Spreads and commissions are crucial considerations when selecting a forex account type, as they directly impact trading costs and profitability.

Traders employing high-frequency trading strategies or frequent position turnover may prioritise account types with low spreads and commission rates to optimise trading performance and efficiency. We understand the importance of tight spreads, and you can review our historical spreads to see our commitment to competitive pricing. All our account types offer the same low costs, ensuring consistency and transparency. Conversely, traders with longer-term investment horizons may be less concerned with spreads and commissions and prioritise other account features, such as access to a diverse range of financial instruments or advanced trading tools.


Guidance on Selecting the Right Account


To choose the right trading account, it's essential to conduct thorough research, compare different options, and consider your individual needs and objectives. Here are some practical steps to guide you through the selection process:


Step One – Research Account Types


Explore the features, benefits, and costs of each account type offered by Fusion Markets, and identify the one that best aligns with your trading style and preferences. 


Step Two – Assess Trading Conditions


Evaluate the trading conditions, including spreads, execution speed, available assets, and platform compatibility, to ensure optimal trading experience.


Step Three– Start Small


Consider starting with a smaller account size and gradually scaling up as you gain experience and confidence in your trading abilities.


Step Four – Review and Adjust


Regularly review your trading performance and account settings, and be prepared to adjust your chosen account type if necessary to adapt to changing market conditions or evolving trading goals.


Conclusion


Understanding the different types of trading accounts is essential for novice traders embarking on their trading journey. By comparing demo accounts with live ones, exploring various live trading account types, and considering key factors when choosing an account, traders can make informed decisions that align with their goals and preferences.


Explore Fusion Markets' range of account options Fusion Markets Trading Accounts to find the perfect fit for your needs. Remember, selecting the right trading account is a critical step towards achieving success in the dynamic world of financial markets.


We’ll never share your email with third-parties. Opt-out anytime.

Relevant articles

Beginners
post image main
Understanding Digital Threats with Broker Chooser

Read Time: 3 Minutes

recent study by BrokerChooser has provided valuable insights into the complex world of online investment fraud, highlighting critical trends that every trader should understand. 


Understanding the Digital Threat 


BrokerChooser's research analysed 1.3 million articles across 56 languages, revealing the sophisticated methods used by fraudulent financial entities. Their findings offer a crucial lens through which we can examine digital financial risks. 


Our Commitment to Trader Protection 


Fusion Markets takes these insights seriously. As a regulated broker operating under both the Vanuatu Financial Services Commission and the Australian Securities and Investment Commission, we've developed a comprehensive approach to safeguarding our clients: 

  • Regulatory Compliance: Maintaining rigorous standards of transparency Identity  

  • Verification: Comprehensive checks to prevent fraudulent activities. 

  • Security Awareness: Ongoing training programmes to help traders identify potential risks 


Key Insights from BrokerChooser's Research 


The study highlighted several critical observations: 

  • Fraudulent entities increasingly use artificial intelligence to appear credible 

  • Cryptocurrency remains a primary target for scam operations 

  • Certain European regions show higher concentrations of fraudulent search activity 


Protecting Yourself in the Digital Trading Landscape 


Drawing from both our experience and Broker Choosers research, we recommend: 

  • Thoroughly researching trading platforms 

  • Verifying regulatory credentials 

  • Maintaining a healthy scepticism towards guaranteed returns 

  • Understanding that all investments carry inherent risks 


The Bigger Picture 


While BrokerChooser's research provides critical data, the real protection comes from continuous education and awareness. Their work serves as an important reminder of the evolving nature of digital financial risks. 


A Commitment to Transparency 


We continue to invest in robust security measures, ongoing trader education, and proactive risk management. Our goal is to provide a secure, transparent trading environment that prioritises our clients' safety and understanding. 

The full research report can be downloaded at https://brokerchooser.com/safe-investing


Stay informed. Stay protected. 

05/12/2024
Beginners
post image main
Top Indicators for Forex Trading and How to Use Them

Read Time: 8 minutes


I used fundamentals for nine years and got rich as a technician” 


– Martin S. Schwartz 
(author of Pit Bull: Lessons from Wall Street's Champion Day Trader). 


Are you leveraging the power of forex indicators in your trading strategy? Indicators play a vital role in identifying trends, assessing price momentum, and pinpointing potential entry and exit points.  


Whilst no single indicator guarantees success, understanding how to properly use a blend of them can greatly improve your trading decisions. However, used incorrectly, they can be devastating to a traders’ performance.


This blog post covers some of the most widely-used forex indicators and how each of them can enhance your forex trading strategy; Moving Averages (MAs), RSI, Bollinger Bands, MACD, and Fibonacci retracements and extensions.  


Table of Contents


Moving Averages


Moving Averages (MAs) are used to identify trends and smooth out price action. Two common types include: 


Simple Moving Average (SMA): Average prices over a specified period, giving equal weight to each data point. 


Exponential Moving Average (EMA): Gives more weight to recent prices, making it more responsive to price changes. 


Moving averages trading helps determine overall trend direction, but can also be used as support and resistance.  


Using MAs for Trend Analysis


The 50-day and 100-day simple moving averages are widely used by traders around the world. As a rule of thumb, the wide the delta between two moving averages, the stronger the trend, as shown in Figure 1 below. 


Figure 1 

Figure 1 Examples of a strong and weakening trend using the 50sma and 100sma. 


Another commonly-used moving average is the 200-day SMA. When combined with the 50-day moving average, traders keep a close eye out for a Golden Cross, or Death Cross, when the 50sma crosses above, or below the 200sma. This pattern has a history of identifying a possible reversal after a strong trend. 


undefined 

Figure 2a – example of a ‘Death Cross’ on the AUDUSD daily chart. 


undefined 

Figure 2b – the resulting change in trend direction. 


Using MAs for Support & Resistance


Some traders use MAs as support and resistance levels for entering, and exiting trades. This method works on all timeframes but is most commonly used for intraday trading. For example, Figure 3 highlights a number of support and resistance points using the 50, 100, and 200 SMA’s on the 15min chart of EURUSD; 


undefined 

Figure 3 – Support and resistance using 50, 100, & 200sma on a 15min EURUSD chart. 


Relative Strength Index (RSI)


The Relative Strength Index (RSI) is a momentum oscillator that measures the speed and change of price movements. It ranges from 0 to 100, providing insight into whether an asset is overbought or oversold. 


Using RSI to identify overbought and oversold extremities: 


  • Overbought (70+): Indicates that an asset may be overvalued and could be vulnerable to a pullback. 

  • Oversold (30 or below): Suggests that an asset may be undervalued, potentially leading to a price rebound. 


Additionally, divergence occurs when the price and RSI move in opposite directions, signalling a potential reversal. For example, if the price makes a new high but the RSI does not, this “bearish divergence” may suggest a decline, as shown in Figure 4 below. 


A graph with lines and arrowsDescription automatically generated with medium confidence 

Figure 4 – RSI divergence on EURUSD 4-hour chart. 


This method of analysis is heavily relied on by pattern and reversal traders. However, it’s important to note that the lower the timeframe you trade on, the more ‘false’ divergence signals you will encounter, thus making this method of analysis more suitable for longer-term swing traders. 


Bollinger Bands


Bollinger Bands consist of a middle SMA line with two outer bands representing standard deviations from this average, creating a channel around price action. The width of the bands indicates market volatility. 


Bollinger Bands Strategy for Breakouts and Squeezes: 


  • Breakout Trading: Price moving beyond the upper or lower band can signal a strong directional move. 

  • The Squeeze: When the bands contract, it indicates low volatility and a potential breakout in either direction. Traders can prepare for a price move when bands begin to widen after a squeeze. 


Figure 5 below shows an example of the contraction (“The Squeeze”), followed by an explosive move upward. 


Figure 5 – Breakout trade on 1-hour EURUSD chart using The Squeeze method.  

Figure 5 – Breakout trade on 1-hour EURUSD chart using The Squeeze method. 


Bollinger bands are typically used with default settings, however, some traders may edit the settings to adapt the indicator to be more closely aligned with their trading stye/strategy. 


MACD (Moving Average Convergence Divergence)


MACD is a trend-following momentum indicator that displays the relationship between two moving averages (commonly the 12-day EMA and 26-day EMA).  


Figure 6 – MACD indicator applied to EURUSD daily chart.  

Figure 6 – MACD indicator applied to EURUSD daily chart. 


The MACD indicator comprises of: 


  • Fast line: The difference between the two MAs (blue). 

  • Slow line: Signal line, which is a 9-day EMA of the MACD line (yellow). 

  • Histogram: Represents the difference between the MACD and the signal line. 


There are many ways to use the MACD in trading. The most common of which, is to identify the end of a trend. 


Interpreting MACD crossovers for trend exhaustion: 

  • Bullish Reversal: The two moving averages are below the zero line, the fast (blue), crosses the slow (yellow) to the upside, and the histogram turns bullish (green). 

  • Bearish Reversal: The two moving averages are above the zero line, the fast (blue), crosses the slow (yellow) to the downside, and the histogram turns bearish (red). 


MACD is often used on higher timeframes to determine whether a current trend is showing signs of exhaustion. In doing so, traders can identify profit-points and/or opportunities for reversal trades. 


Fibonacci Retracement


Fibonacci retracement levels are horizontal lines drawn at specific price points that can act as potential support and resistance levels. These levels are derived from the Fibonacci sequence and include 23.6%, 38.2%, 50%, 61.8%, and 78.6%. 


How to Use Fibonacci Retracement: Identify a significant peak and trough in the price chart, then draw the retracement lines to determine possible areas of reversal. Many traders use Fibonacci levels to predict areas where pullbacks might end, providing opportunities to enter trades in the direction of the main trend, as shown in Figure 7 below. 


A graph of stock market 

Figure 7 – Example of using Fibonacci retracements for trade entry. 


As shown in Figure 7, the Fibonacci tool is drawn from the previous high, to the previous low. In this example, we’ve used the most common retracement levels – 38.2%, 50%, and 61.8%. 


Fibonacci levels are effective on all timeframes and work extremely well in conjunction with other technical analysis indicators. 


Using and Combining Indicators Effectively


Whilst each indicator provides valuable insights, using multiple indicators can prevent produce more reliable signals. Here are some practical tips: 


  • Avoid clutter: Using similar indicators (e.g., two momentum indicators) may clutter charts without adding any significant value. 

  • Complementary combinations: For example, combining RSI with MACD can offer insights into both trend strength and momentum. Additionally, pairing Bollinger Bands with Moving Averages can highlight breakout opportunities and trend directions. 

  • Multiple timeframes: Balancing indicators across different timeframes allows you to gauge the broader trend while identifying precise entry and exit points. 


Every technical analysis indicator has its own strengths and weaknesses, so what might work for one trader, might not work for another


Pros and Cons of Indicators


Here are some Pros and Cons of the indicators we’ve discussed in this blog post; 

Moving Averages

  • Pros:
    • Smooths trends
    • Acts as dynamic support/resistance
    • Versatile across different timeframes


  • Cons:
    • Lags in fast-moving markets
    • Prone to false signals
    • Often requires confirmation from other tools


Relative Strength Index (RSI)

  • Pros:
    • Identifies overbought and oversold conditions
    • Provides divergence signals
    • Simple to learn and interpret


  • Cons:
    • Can generate false signals
    • Limited effectiveness in ranging markets
    • May stay in overbought or oversold zones for extended periods


Bollinger Bands

  • Pros:
    • Measures market volatility
    • Provides breakout signals
    • Makes spotting volatility easy


  • Cons:
    • Can be complex to interpret
    • Prone to false signals
    • Does not provide clear directional information


MACD (Moving Average Convergence Divergence)

  • Pros:
    • Combines trend and momentum analysis
    • Generates clear crossover signals
    • Histogram visually represents momentum changes

  • Cons:
    • Lagging indicator
    • Less effective in sideways markets
    • Can produce false signals


Fibonacci Retracements

  • Pros:
    • Highlights natural support and resistance levels
    • Works well in conjunction with other indicators
    • Useful in trending markets

  • Cons:
    • Placement of levels can be subjective
    • Often requires confirmation from other tools
    • Not all price pullbacks respect Fibonacci levels

We strongly recommend looking into all the different technical analysis tools and forex indicators available, find the ones that ‘make sense’ to you, and research into how they are calculated and how they were intended to be used. From there, you can adapt the settings as needed to fit your trading style and strategy. 


Conclusion


Incorporating the right indicators, whether it’s Moving Averages, RSI, Bollinger Bands, MACD, Fibonacci retracement, or other, can provide a more comprehensive view of market conditions, allowing you to become more confident in your analysis.  

Remember, whilst indicators offer insights, they are most effective when personalised to fit your strategy and continuously practiced. So, experiment with these tools, find what works best for you, and let your trading skills evolve.  

Ready to get started? Open an account with us.  


Remember: Successful forex trading requires a balance of economic insight, technical skill, and disciplined risk management. Stay informed, practise consistently, and adapt your strategies to ever-changing market conditions. 


03/12/2024
Ready to Start Trading?
Get started live or get a free demo