Loading...
No results

Unveiling the Power of Spreads: Trade Smarter with Fusion Markets' Spreads Tool

Fusion Markets

post content image

Are you ready to talk about spreads? Sure, you might think that there is nothing you have not heard before.  


John Wooden, an American basketball coach, said it best: “The eight laws of learning are explanation, demonstration, imitation, repetition, repetition, repetition, repetition, repetition.” 


So, hear me out. The spread is one of the most important concepts in forex trading, and understanding how it works can have a significant impact on your trading game. 


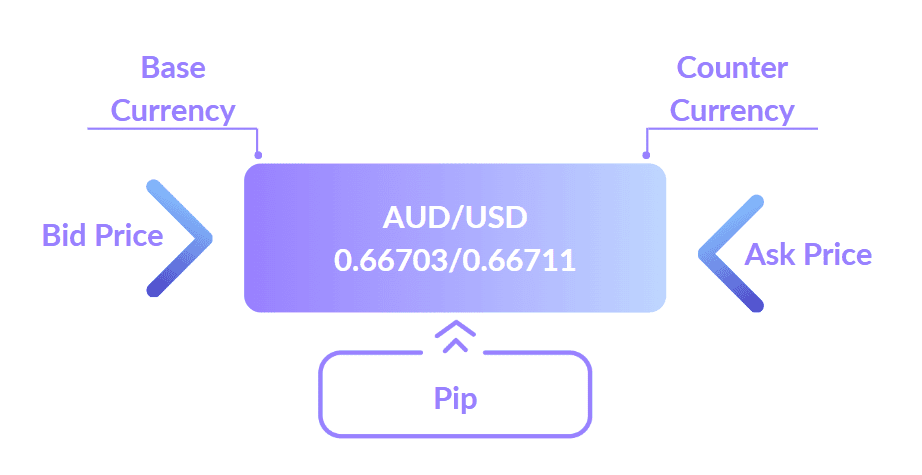
First things first, let's define what a spread is. In forex trading, a spread is the difference between the bid and ask price of a currency pair. The bid price is the price at which you can sell the currency, while the ask price is the price at which you can buy it.  

undefined

The size of the spread can vary depending on a number of factors, including the volatility of the market, the liquidity of the currency pair, and the broker you are using. In general, the more volatile and illiquid a currency pair is, the larger the spread will be. 


Now, picture this: you have finally decided to dip your toe into the exciting world of forex trading. You have done your research, chosen a broker, and you are ready to make your first trade. But wait - what is this? The spread on your chosen currency pair is wider than the Grand Canyon. Suddenly, your dream of becoming a successful forex trader starts to feel like a distant memory. 


Okay, maybe that is a bit dramatic. But the point is, the spread can make a substantial difference in your forex trading experience. And when it comes to spreads, tighter is always better. 


So, why is it important to trade with tight spreads? 


For starters, tighter spreads mean lower trading costs. Some brokers might increase their spreads as part of their fee, which is why on some account types, the commissions are baked into the spreads. Remember that there are also several factors that might have an impact on the spreads. If the spread is wider, that means you are paying more in fees every time you buy or sell a currency pair. Over time, those fees can really add up, eating into your profits and making it harder to achieve your trading goals. 


But it is not just about the cost. Tighter spreads can also improve your chances of making a profit. When the spread is wider, it means there is a larger gap between the bid and ask price. This can make it harder to enter and exit trades at the price you want.  


For example, if you are trying to buy a currency pair, but the ask price is much higher than the bid price, you might end up paying more than you intended. Conversely, if you are trying to sell a currency pair, but the bid price is much lower than the ask price, you might end up receiving less than you wanted. These slight differences may not seem like a big deal, but over time, they can make a significant impact on your overall profitability. 


It is important to keep in mind that not all brokers offer the same spreads. Some brokers may advertise low spreads, but then widen them during periods of high volatility or low liquidity. That is why it is important to do your research and choose a reputable broker with consistent pricing.  


But how do you know if your broker is offering you competitive spreads?  


Of course, you want a broker who is open and honest about their pricing and fees, and who is willing to provide you with the tools and information you need to make smart trading decisions.  


And that is where our new tool comes in. At Fusion Markets, we are committed to providing our clients with the best possible trading conditions and that means being upfront about pricing and fees. That is why we designed our new Historical and Live Spreads tool.  


undefined

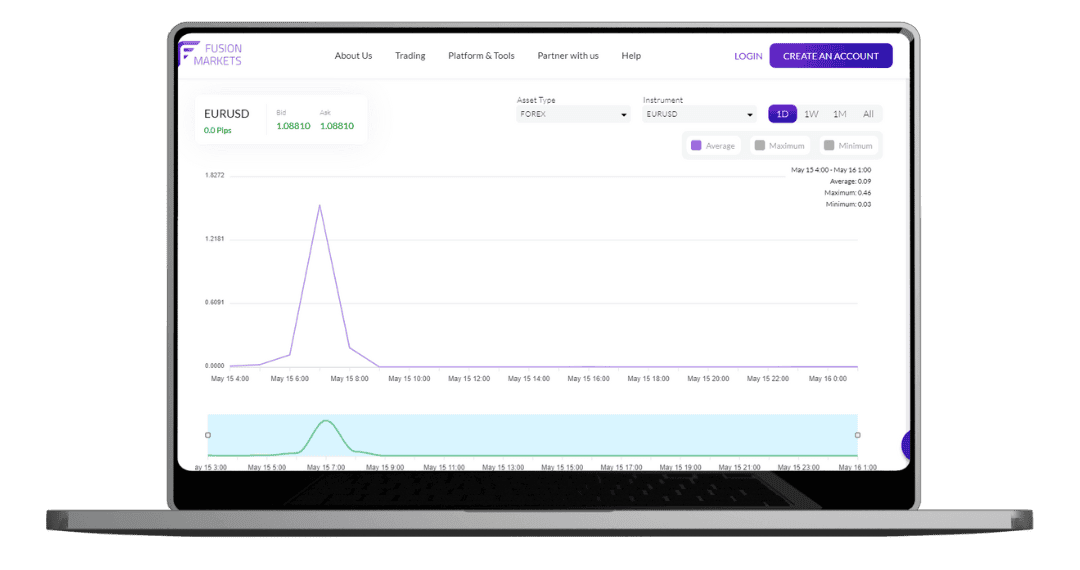
This tool allows traders to view the historical spreads of a particular currency pair over a specified time frame, as well as the current live spreads. This information can be incredibly valuable in helping you make informed decisions about when to enter and exit trades. No more surprises, no more hidden fees – just transparent, competitive pricing. 


Think about it - with this tool, you can see how spreads have fluctuated over time, and get a sense of what a "normal" spread looks like for a particular currency pair. This can help you identify when spreads are wider than usual and avoid trading during times when you might be paying more in fees than you need to. 


And that is not all - the historical and live spreads tool also helps to promote transparency in the forex industry. We believe that our clients deserve to know exactly what they are paying in fees, and that is why we are committed to providing this information in a clear and accessible way. 


If you want to maximise your profits and develop a winning trading strategy, you owe it to yourself to check out our new tool. With its help, you can trade with greater confidence, knowing that you are getting the best possible pricing and keeping more of your hard-earned profits.  


So, what are you waiting for? Try out our Historical and Live Spreads Tool today and see how it can help take your trading to the next level. Trust us - you will not regret it! 


For more detailed information about our Spreads tool download our guide. 


DOWNLOAD GUIDE

We’ll never share your email with third-parties. Opt-out anytime.

Relevant articles

Trading and Brokerage
post image main
Exploring Different Trading Instruments
Fusion Markets
A diverse range of trading instruments is available in the financial markets, each presenting its own set of opportunities and challenges for investors.


Introduction


Forex stands out as the largest and most liquid market globally, facilitating currency exchange 24/5 across major financial centres worldwide. Meanwhile, precious metals like gold, silver, and platinum hold enduring appeal as timeless assets valued for their intrinsic worth and utility across various industries.  


  • Indices, such as the S&P 500, offer snapshots of broader market performance, guiding investors in tracking trends and making informed decisions about resource allocation.  

  • Cryptocurrencies, such as Bitcoin and Ethereum, have disrupted traditional finance with their decentralised and highly volatile nature, reshaping the financial landscape.  

  • US share CFDs provide traders with leveraged exposure to American equities without owning the underlying assets, opening up avenues for speculation and hedging within the dynamic US stock market. 


Understanding the distinct characteristics and dynamics of each trading instrument is crucial for navigating the financial markets effectively. Each instrument has its own unique features, including liquidity, volatility, and correlations with other assets, which significantly impact trading strategies and risk management approaches.  


For example, forex trading thrives on its liquidity and accessibility but is also prone to significant volatility and sensitivity to economic indicators. On the other hand, precious metals often serve as safe-haven assets during times of economic uncertainty but are subject to supply and demand dynamics and geopolitical tensions.  


By understanding each asset's characteristics, traders can tailor their strategies to suit specific instruments, maximising opportunities and mitigating risks for consistent and profitable trading outcomes. 

Forex Icon

Forex Trading


The foreign exchange market is a global decentralised marketplace where currencies are traded. Participants include banks, financial institutions, corporations, governments, and individual traders.  


Currency pairs represent the exchange rate between two currencies. The most commonly traded pairs include EUR/USD (Euro/US Dollar), GBP/USD (British Pound/US Dollar), and USD/JPY (US Dollar/Japanese Yen). Each pair consists of a base currency and a quote currency, with the exchange rate indicating how much of the quote currency is needed to purchase one unit of the base currency.  


Forex trading operates 24 hours a day, five days a week, across major financial centres worldwide, including London, New York, Tokyo, and Sydney. This continuous trading cycle allows for around-the-clock trading, providing ample opportunities for market participants to engage in buying and selling currencies. 


What moves prices


There are many factors that contribute to the volatile price movements. Economic indicators play a significant role, including interest rates, inflation rates, gross domestic product (GDP) growth, employment figures, and trade balances. Central bank policies, such as monetary policy decisions and interventions in currency markets, can also impact currency valuations.  


Geopolitical events and developments, such as political instability, trade tensions, and conflicts, can cause sudden shifts in investor sentiment and currency flows. For example, the current conflicts in Ukraine and Gaza.  


Market sentiment, driven by speculation, fear, and greed, can lead to short-term fluctuations in currency prices. Traders often employ a combination of fundamental and technical analysis to anticipate market movements and make informed trading decisions in the dynamic forex market environment. 

undefined

Precious Metals Trading


Precious metals, including gold, silver, and platinum, have captivated humanity for centuries due to their inherent beauty, scarcity, and utility.  


Gold, often referred to as the "king of metals," holds a special place in history as a symbol of wealth, luxury, and stability. Its lustrous appearance and resistance to corrosion make it ideal for jewellery and ornamental purposes.  


Silver, known for its affordability and versatility, boasts a wide range of industrial applications, from electronics to medicine.  


Platinum, rarer and more precious than gold, is coveted for its durability and resistance to tarnishing, primarily used in catalytic converters, jewellery, and laboratory equipment. Together, these precious metals form the cornerstone of investment portfolios, serving as safe-haven assets and hedges against inflation and economic uncertainty. 


What moves prices


The prices of precious metals are influenced by a complex interplay of supply and demand dynamics, along with various economic factors.  


On the supply side, mining production, exploration efforts, and recycling rates impact the availability of precious metals in the market. Geopolitical factors, including mining regulations, labour strikes, and geopolitical tensions, can disrupt supply chains and affect production levels.  


Demand for precious metals stems from diverse sources, including jewellery fabrication, industrial manufacturing, investment demand, and central bank reserves.  


Economic indicators, such as interest rates, inflation expectations, and currency valuations, also exert significant influence on precious metals prices. For instance, during times of economic uncertainty or inflationary pressures, investors flock to precious metals as store-of-value assets, driving prices higher. On the contrary, a strengthening economy or rising interest rates may dampen demand for precious metals, leading to price declines.  


Understanding these supply and demand dynamics, coupled with macroeconomic trends, is essential for investors and traders seeking to navigate the intricacies of the precious metals market. 

Stock Market Image

Indices Trading


Stock market indices, such as the S&P 500, play a pivotal role in providing investors with insights into the performance of specific segments of the financial markets. The S&P 500, for example, represents a diverse basket of 500 large-cap US companies, spanning various industries and sectors. These indices serve as benchmarks, allowing investors to gauge the overall health and direction of the stock market. Additionally, they facilitate portfolio diversification and asset allocation strategies by providing a broad overview of market trends and movements. 


Stock market indices are calculated using weighted averages of constituent stocks' prices or market capitalisations. The weighting methodology varies depending on the index, with some indices employing market-cap weighting, where larger companies exert a greater influence on the index's performance, while others utilise price weighting or equal weighting.  


What moves prices


Changes in the prices of constituent stocks, driven by factors such as corporate earnings, macroeconomic indicators, and investor sentiment, impact the index's value.  


Indices are rebalanced periodically to reflect changes in market dynamics, ensuring their relevance and accuracy in tracking overall market performance. By tracking indices, investors can assess the performance of their portfolios relative to the broader market, identify trends, and make informed investment decisions based on market benchmarks. 

undefined

Cryptocurrency Trading


The cryptocurrency markets exhibit unique features that distinguish them from traditional financial markets, with volatility and decentralisation standing out as prominent characteristics.  


Volatility, fuelled by speculative trading, market sentiment, and regulatory developments, is inherent to cryptocurrency markets, leading to rapid price fluctuations and heightened risk.  


Additionally, cryptocurrencies operate on decentralised blockchain networks, bypassing traditional financial intermediaries like banks and enabling peer-to-peer transactions. This decentralisation fosters transparency, security, and censorship resistance, empowering individuals to control their assets and participate in a borderless financial ecosystem.  


Despite the challenges posed by volatility and regulatory uncertainty, the decentralisation of cryptocurrencies continues to disrupt traditional financial systems, offering a glimpse into the future of finance. 

undefined

US Share CFDs Trading


US Share CFDs trading offers investors a flexible and leveraged approach to accessing US equity markets without owning the underlying assets.  


Contracts for Difference (CFDs) allow traders to speculate on the price movements of US shares, including popular companies such as Apple, Google, and Amazon, without the need for direct ownership.  


CFDs provide flexibility, enabling traders to take both long and short positions on US shares, thereby capitalising on both rising and falling markets. However, it's essential to acknowledge the risks associated with CFD trading, such as leverage-induced losses, counterparty risk, and overnight financing charges.  


In addition to maintaining strict risk management, traders need to stay informed about market developments, and conduct thorough research, in order to mitigating risk and achieving long-term success in trading US share CFDs. 


Click here for more information on the trading products provided by Fusion Markets.

undefined

Choosing the Right Trading Instruments


Selecting the right trading instruments is a critical decision that hinges on various factors, including individual trading goals, experience level, and risk tolerance.  


Novice traders may opt for instruments like forex or precious metals, known for their liquidity and relatively lower entry barriers.  


Experienced traders, on the other hand, might explore more complex instruments such as cryptocurrencies or US share CFDs, leveraging their market knowledge and risk management skills.  


It's essential to align chosen instruments with specific trading objectives, whether it be short-term speculation or long-term investment. Additionally, understanding one's risk tolerance is essential, as certain instruments, like cryptocurrencies, are inherently more volatile than others and may not suit everyone's risk appetite. 


Diversification and portfolio management also play a crucial role in mitigating risk and optimising returns when trading multiple instruments. Diversifying across different asset classes, such as stocks, bonds, commodities, and currencies, helps spread risk and minimise exposure to any single market or sector.  


Additionally, within each asset class, diversification can be achieved by selecting a mix of instruments with varying risk profiles and correlations. Effective portfolio management involves regularly reviewing and rebalancing the portfolio to ensure alignment with changing market conditions and investment objectives. By diversifying and actively managing their portfolios, traders can enhance resilience against market fluctuations and achieve more consistent and stable returns over the long term. 


Conclusion


Navigating the diverse array of trading instruments demands a comprehensive understanding of their respective characteristics and dynamics. From the liquidity of forex markets to the resilience of precious metals, each instrument presents unique opportunities and challenges for traders.  


By embracing sound risk management principles, honing analytical skills, and aligning trading strategies with individual objectives, market participants can prosper in any market environment.  


As you dive deeper into the world of trading, we encourage you to explore our range of products and accounts at Fusion Markets, empowering you to seize opportunities and chart your path to financial success.

Trading Instruments
Forex Trading
Precious Metals
Stock Indices
Cryptocurrencies
US Share CFDs
Financial Markets
25.07.2024
Trading and Brokerage
post image main
Index CFD Dividends | Week 22/07/2024
Fusion Markets

Please see the table below for any upcoming dividend adjustments on indices for the week starting July 22nd, 2024.


Dividend Table 22.07.2024

* Please note these figures are quoted in the index point amount


What is a dividend?


Dividends are a portion of company earnings given to shareholders. As indices are often composed of individual shares, an index dividend pays out based on individual shares proportional to the index’s weighting.


Trading on a CFD Index does not create any ownership of the underlying stocks, or an entitlement to receive the actual dividends from these companies.


What is an ex-dividend date?


An ex-dividend date is the cut-off date a share must be owned in order to receive a dividend. If an investor buys a share after the ex-dividend date, then they will not be entitled to earn or pay the next round of dividends. This is usually one business day before the dividend.


Do dividends affect my position?


Share prices should theoretically fall by the amount of the dividend. If the company has paid the dividend with cash, then there is less cash on the balance sheet, so in theory, the company should be valued lower (by the amount of the dividend).


Due to the corresponding price movement of the stock index when the ex-dividend date is reached, Fusion must provide a 'dividend' adjustment to ensure that no trader is positively or negatively impacted by the ex-dividend event.


How will the dividend appear on my account?


The dividend will appear as a cash adjustment on your account. If your base currency is different from the currency the dividend is paid out in, then it will be converted at the live FX rate to your base currency.


Why was I charged a dividend?


Depending on your position, given you are holding your position before the ex-dividend date, you will either be paid or charged the amount based on the dividend. Traders shorting an index will pay the dividend, whereas traders who are long the index will be paid the dividend.


Why didn’t I receive my dividend?


You may not have received a dividend for a number of reasons:


- You entered your position after the ex-dividend date

- You are trading an index without dividend payments

- You are short an index


If you believe the reasons above do not apply to your position, please reach out to our support team at [email protected] and we’ll investigate further for you.


Forex Trading
CFD
Dividends
01.07.2024
Ready to Start Trading?
Get started live or get a free demo