Loading...
No results

TradingView vs. MetaTrader

Fusion Markets

post content image
Read time: 8 minutes.
   

For technical analysis traders, choosing the right trading platform is crucial for success. In this article, we'll compare two industry-leading platforms: TradingView and MetaTrader, highlighting their unique features and helping you decide which one best suits your trading style.


Table of Contents


Key Takeaways


  • TradingView offers an intuitive interface and advanced charting tools, ideal for visual learners and technical analysis.
  • MetaTrader provides powerful automation capabilities and faster execution, especially suitable for experienced traders.
  • TradingView is powered by cTrader, which may introduce some lag but offers simple bot creation with PineScript.
  • MetaTrader has an older interface but excels in customization and supports a wider range of markets, including stocks.
  • Both platforms can be connected to your Fusion account for direct trading.
  • Consider trialling both platforms on a demo account to determine which best fits your trading style.


undefined


TradingView


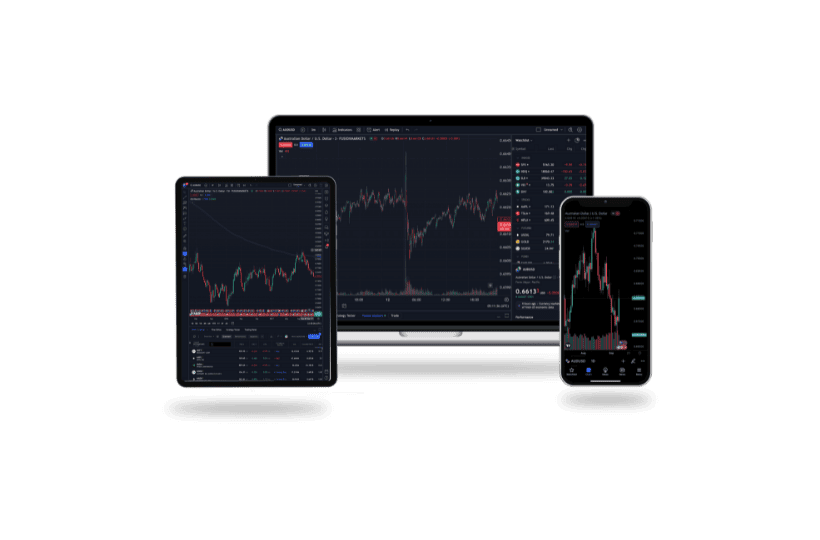
TradingView is renowned for its user-friendly interface and advanced charting tools. It caters to traders of all levels, offering an intuitive design that simplifies the trading process. One of TradingView's standout features is its extensive library of indicators and drawing tools, making it a favourite among visual learners who rely heavily on technical analysis. There’s almost no drawing tool or indicator that you cannot find on TradingView. 


TradingView's interface is not only easy to navigate but also highly customisable, allowing users to set up their workspace according to their preferences. This flexibility is particularly beneficial for traders who like to have all their essential tools and information readily accessible. And the best part, it syncs across all your devices, with a downloadable app for your phone and computer.  


The platform also has a strong community aspect, allowing traders to share ideas, strategies, and charts with others. This social feature provides a collaborative environment where traders can learn from each other and share strategies and technical tools. 


The platform's social network is vibrant, with millions of traders from around the world sharing their insights and analysis. This community-driven approach can be incredibly valuable for both novice and experienced traders looking to gain different perspectives and improve their trading strategies. 


TradingView provides most of its products for free, but its paid subscription-based model is what really brings it to life. With additional chart types and the ability to load multiple charts on one screen, the value is present for technical-based traders. 


For traders, understanding how to read the forex economic calendar is crucial, and TradingView makes it easy to stay informed. Major economic events, such as interest rate announcements, employment reports, and GDP releases, can significantly impact market movements. The economic calendar provides traders with a roadmap of these events, helping them anticipate volatility, make informed trading decisions, and align their strategies with broader economic trends. With TradingView, traders can seamlessly integrate these key dates into their workflow, ensuring they are prepared to respond effectively to market changes.


undefined


MetaTrader


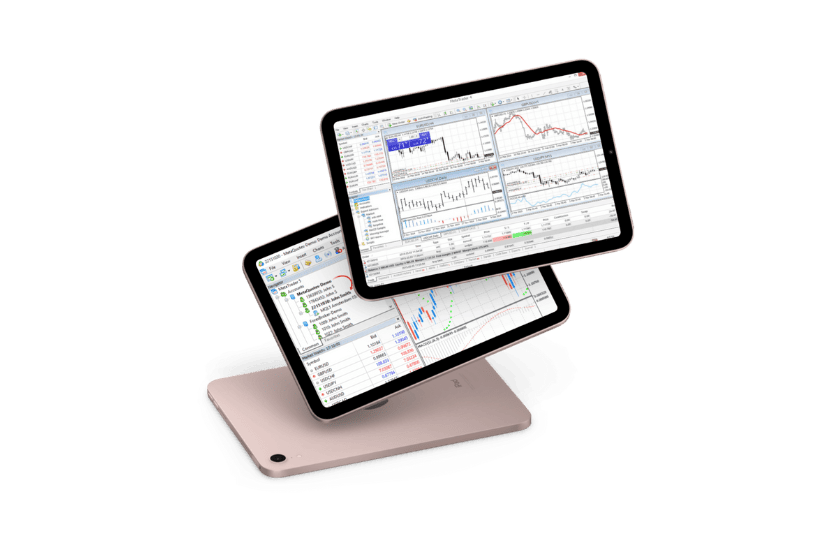
MetaTrader is arguably the most well-known forex trading platform. Having been around for a very long time (2005), it’s long been the go-to for most traders, with most now using MetaTrader4, or MetaTrader5. 


Known for its powerful automation capabilities, which are particularly appealing to experienced traders, the platform offers advanced features such as Expert Advisors (EAs), allowing users to automate their trading strategies. This can be a game-changer for those who want to implement complex trading systems without constant manual intervention. 


MetaTrader’s automation capabilities extend beyond just executing trades. The platform allows traders to back-test their strategies using historical data, providing valuable insights into the potential performance of their trading systems. This feature is particularly useful for traders who wish to develop their own EAs and want to ensure they perform well under various market conditions. 


Though somewhat dated, MetaTrader provides deep market access with features like multiple order types, comprehensive charting tools, and a range of technical analysis options. Its robust architecture supports a wide array of customisations and add-ons, giving traders the flexibility to tailor the platform to their specific needs. Whether you are trading forex, commodities, or CFDs, Meta Trader's extensive range of tools and functionalities ensures you have everything you need to make informed trading decisions. 

MetaTrader is completely free to use, with the option of purchasing additional EA’s, drawing tools, or various other add-ons from third-party users through the MQL5 market.  


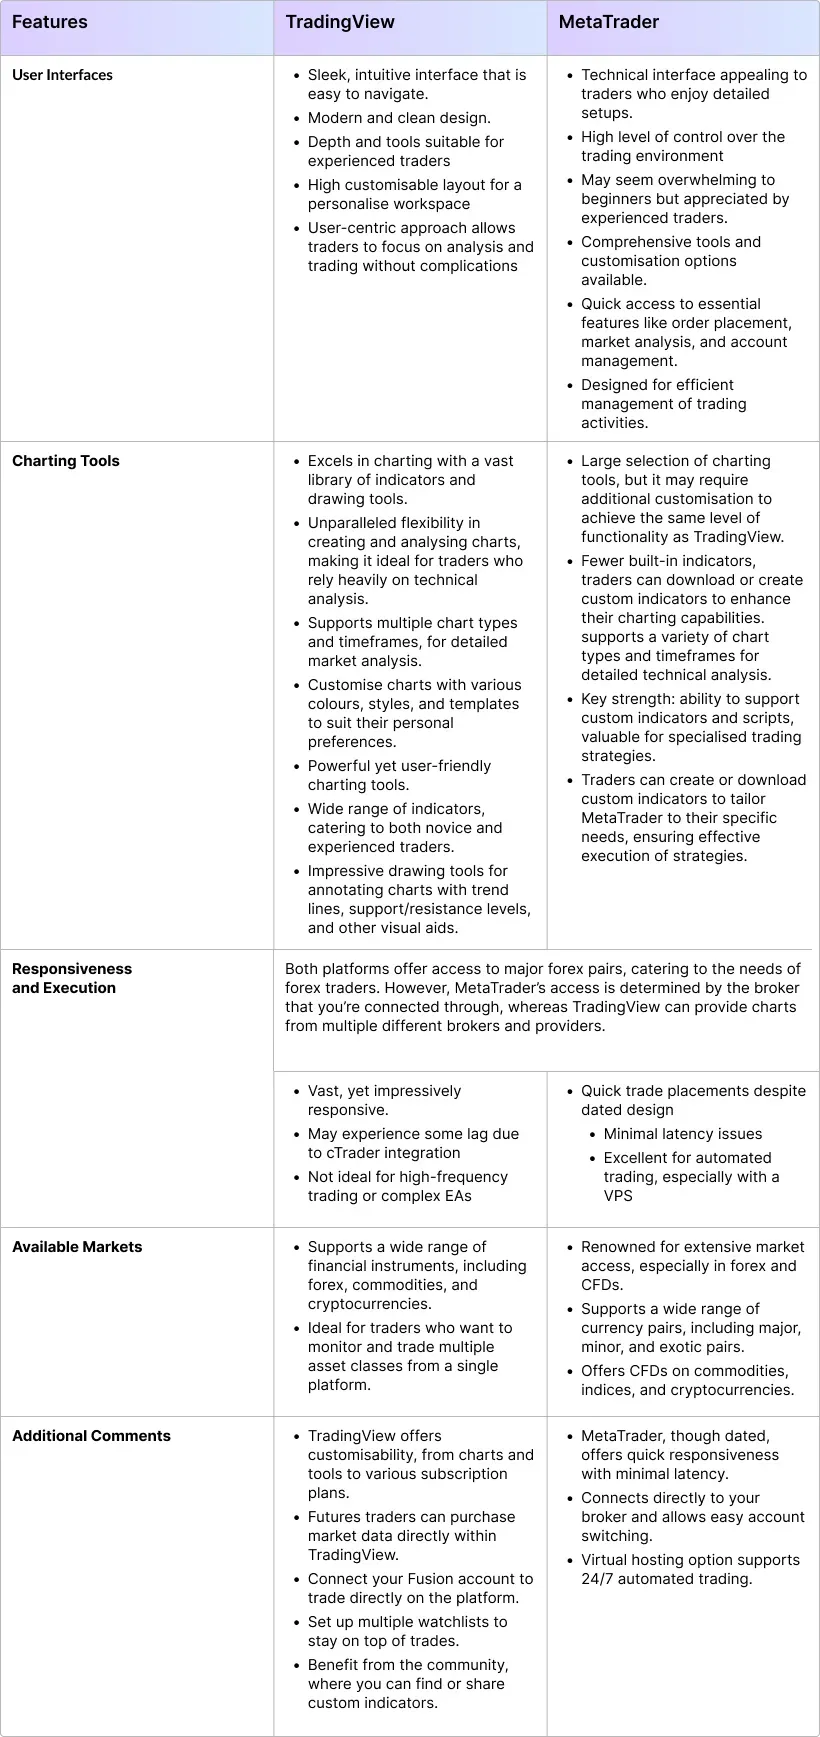
Forex Platform Comparison: TradingView vs. MetaTrader


MetaTrader v TradingView Table


Which is Right for You?


Choose TradingView if you value:

  • Intuitive interface and advanced charting tools
  • Community insights and social trading features
  • Ease of use for beginners
  • Simple bot creation with PineScript


Choose MetaTrader if you prioritise:

  • Powerful automation capabilities with Expert Advisors
  • Fast execution speeds, especially with a VPS
  • Access to a wide range of markets, including stocks
  • Advanced customisation and flexibility


Conclusion


Both TradingView and MetaTrader offer unique strengths that cater to different trading styles and preferences. Consider your trading goals, experience level, and the features most important to you when making your choice. 

We recommend trialling both platforms on a demo account to determine which suits your trading style best. Both can be connected to your Fusion account for direct trading. 


For More Information:


Still unsure? Reach out to our friendly help team at [email protected] using the chat function on the bottom right of this screen.

We’ll never share your email with third-parties. Opt-out anytime.

Relevant articles

Beginners
post image main
The Fibonacci Cheat Sheet

Read Time: 6-7 minutes


Essential Ratios Every Beginner Trader Should Know. The Fibonacci sequence and the golden ratio have long fascinated mathematicians, scientists, and artists. Their influence extends across every aspect in life and can be observed in nature, architecture, and even the financial markets. Fibonacci-based tools are readily available and can assist in identifying entry and exit points, retracement lengths and more.


What is Fibonacci and Why Does It Matter in Trading?


The Fibonacci sequence consists of a series of numbers where each value is the sum of the two preceding numbers, starting from 0 and 1. For example, 1+1=2, 1+2=3, 2+3=5, and so on. When we continue this pattern we get:


0, 1, 1, 2, 3, 5, 8, 13, 21, 34, 55, 89, 144, 233...


Taking it one step further, if we observe the mathematical correlations between these numbers, we identify a range of ‘ratios’. For example, if we divide 21 by 34, we get 0.618%. If we divide 21 by the number two spots to the right (55), we get 38.2 and so on.


This mathematical constant appears in various natural and human-made structures, from spiral galaxies to architectural designs, and even nature.

undefined

In trading, Fibonacci ratios can help analyse price action, pinpointing areas where market trends may pause, reverse, or accelerate. By learning to apply these ratios, you can identify potential support and resistance levels, retracement zones, and projected price targets, ultimately giving you better entries and exits on your trades.


Breaking Down the Key Fibonacci Ratios


The most widely used Fibonacci ratios in forex trading originate from the relationships between sequence numbers. As an example, some of the most commonly used in trading include:


  • 23.6% – A minor retracement level often observed in strong trends.
  •      
  • 38.2% – A commonly used retracement level where price corrections may occur.
  •      
  • 50% – Not an official Fibonacci ratio, but significant due to psychological factors.
  •      
  • 61.8% – The golden ratio, a crucial level for support and resistance.
  •      
  • 78.6% – A deeper retracement level where strong reversals may occur.
  •      
  • 161.8% – A common extension level used to forecast potential price targets.
  •    
   

These ratios are applied using Fibonacci retracements and extensions.


How to Use Fibonacci Retracements


We have explained Fibonacci retracements as one of the indicators that we have discussed here on our blog before. A trend is a significant price movement in one direction, followed by a price movement in the opposite direction, followed by a price movement in the direction of the initial trend. You can use Fibonacci retracement levels to determine where these pullbacks might find support or resistance. You can get better entries and/or exits on your trades by doing this.


Fibonacci Retracements


For example, during a bullish trend, price may retrace to the 38.2%, 50%, or 61.8% level before continuing higher. This can also be observed in a downtrend, where these levels can serve as potential swing points where price might pause or reverse before resuming its downward trend.


How to Use Fibonacci Extensions


While retracements focus on pullbacks, Fibonacci extensions project potential price targets beyond the original price movement, using the same ratios. These levels help estimate how far price may travel after a retracement completes – ultimately leading to better profit targets/exit points.


The 161.8% extension, often called the "golden mean," is one of the most significant levels. It frequently acts as a target in strong trends, marking potential areas where price may consolidate or reverse.


Extensions are particularly useful for setting profit targets, as they provide logical exit points based on prior price action.


A graph with a line and a dotted line


AI-generated content may be incorrect.


Fibonacci Clusters: Combining Multiple Levels for Strong Trade Setups


A Fibonacci cluster forms when multiple Fibonacci levels from different price swings converge at a similar price point. These clusters can help identify the stronger swing points, which often lead to market reactions.


Traders often use these clusters for:


  • Identifying precise entry points
  •    
  • Setting stop-loss levels
  •    
  • Establishing profit targets


  •  


Figure 1 – AUDUSD Weekly Chart


For instance, if a 61.8% retracement from a major trend aligns with a 161.8% extension from a smaller move, the resulting zone becomes a high-probability trade area.


Step-by-Step Guide to Using Fibonacci in Your Trading


To effectively use Fibonacci techniques in forex trading, follow these steps:


  1. Identify Key Price Swings – Look for significant highs and lows as reference points for Fibonacci retracement or extension tools. It’s important that you’re drawing the tool using the correct swing high and lows of each move.
  2.    
  3. Plot Fibonacci Levels – Use charting software, such as MetaTrader or TradingView, to overlay Fibonacci levels on key price movements.
  4.    
  5. Look for Areas of Confluence – Check if the Fibonacci levels align with other technical indicators, such as moving averages, trendlines, support/resistance zones, or even other Fibonacci levels.
  6.    
  7. Observe Price Reactions – Monitor how the market responds to each Fibonacci level, looking for confirmation through price action signals like candlestick patterns.
  8.    
  9. Manage Risk Effectively – Define risk-reward parameters using Fibonacci-based stop-loss and take-profit levels.
  10.  
 

Final Thoughts


The Fibonacci sequence and golden ratio help to structure the way the market behaviour is analysed, and the major price levels are identified. You can enhance your technical analysis and, by result, decision-making, by applying Fibonacci retracements, extensions, and clusters.


However, it is crucial to mention that no tool is 100% accurate and that the use of Fibonacci tools can greatly enhance a sound trading strategy by providing more potential entry and exit points. However, like any other indicator, there are no guarantees, so it is recommended to look for a reaction and/or confirmation of each Fibonacci level before making the trade.


18/03/2025
Beginners
post image main
Leveraging Economic Indicators

Read Time: 6 minutes


For successful forex trading, economic indicators are essential tools in understanding market trends and predicting potential currency movements. These indicators, such as GDP, employment data, inflation rates, and more, provide a window into the economic health of a country, which ultimately influences currency values across the market.  

Understanding the influence of economic indicators allows you to make informed decisions based on more accurate analysis, increasing the likelihood of profitable trades.  


Table of Contents


Key Economic Indicators


Gross Domestic Product (GDP)


GDP is the total market value of all goods and services produced within a country, reflecting its economic health.

A rising GDP often signifies a strong, growing economy, which can boost a nation’s currency due to investor confidence. Conversely, a declining GDP might signal economic trouble, potentially weakening the currency. For forex trading, GDP data can help identify long-term currency trends, particularly when compared across different nations.


Employment Data


Employment data is a major economic indicator with a substantial impact on currency values, particularly the Non-Farm Payrolls (NFP) data in the United States.

The NFP measures employment changes outside the farming sector, providing a snapshot of the U.S. job market. When job creation is strong, it suggests economic health, often strengthening the currency as investors and traders feel confident.

Weak employment figures can suggest economic issues, potentially leading to currency depreciation. Since employment is closely tied to consumer spending and economic stability, this data can be very valuable for traders.


Inflation Rates


Inflation, primarily measured by the Consumer Price Index (CPI), reflects the rate at which prices for goods and services increase.

Moderate inflation is generally healthy, indicating a growing economy. However, high inflation can devalue a currency as purchasing power declines. Central banks often adjust interest rates in response to inflation; if inflation is high, they may raise rates to control it, which can attract foreign investors seeking higher returns, thus strengthening the currency. Understanding inflation’s impact on interest rates and currency valuation is vital for forex traders.


Interest Rates


Interest rates are the cost of borrowing or the return on savings, set by central banks to regulate economic activity and influence currency value.

Interest rates are among the most influential economic indicators in forex. Central banks set these rates based on economic conditions, adjusting them to either stimulate or cool down the economy. Higher interest rates often attract foreign investment, increasing demand for the currency and boosting its value. Conversely, lower interest rates can make a currency less appealing to investors, leading to depreciation. For forex trading, interest rate changes and the policies of central banks (such as the Federal Reserve in the U.S. or the Reserve Bank of Australia) provide critical insights into likely currency movements.


Consumer Confidence Index (CCI)


The Consumer Confidence Index measures consumer sentiment and expectations regarding the economy.

High consumer confidence can indicate increased spending, which drives economic growth, while low confidence suggests economic uncertainty. CCI is considered a leading indicator, as consumer sentiment often precedes actual economic changes. When consumers feel positive about the economy, the currency may strengthen; when confidence drops, the currency may weaken. Forex traders use the CCI to anticipate changes in spending behaviour and overall economic direction.


Interpreting Economic Indicators


In forex trading, interpreting economic indicators requires understanding both individual data points and the relationships between them. Economic indicators can influence currency values in varying degrees, with some holding more weight than others. Traders must also consider correlations, as indicators like GDP and employment data often move together, giving a clearer picture of economic health.

One challenge traders face is managing contradictory signals. For example, strong employment data may suggest a strong currency, but if inflation is simultaneously high, it could lead to fiscal and monetary policy changes, ultimately impacting the currency differently. Weighing the significance of each indicator helps traders decide when to take action and which indicators align with their trading objectives.


Essential Economic Indicators and Practical Application


- For traders just starting with fundamental analysis, some economic indicators offer a straightforward approach to understanding market dynamics:

- Non-Farm Payrolls (NFP): Released monthly by the U.S. Bureau of Labor Statistics, NFP provides a quick look at employment trends, making it a critical indicator for traders.

- Consumer Price Index (CPI): CPI reflects inflation and purchasing power, directly influencing central bank policy and forex rates.

- Central Bank Interest Rate Decisions: Rate changes have immediate and often lasting impacts on currency valuation, making them a fundamental factor in forex trading.

You can find the details of every economic data event using our Economic Calendar.

Accessing timely and reliable economic data is crucial. Many traders use economic calendars, such as our one here, which provide release dates for upcoming economic data, allowing them to plan trades around these announcements. Economic calendars are invaluable tools for tracking data releases, setting alerts, and managing expectations for market volatility.

It's also important to be mindful of common misinterpretations, such as assuming that a single indicator will drive long-term trends. Forex markets are influenced by a multitude of factors, so it’s essential to view each indicator within a broader economic context.


Synergising Economic Indicators with Technical Analysis


Whilst economic indicators provide insights into a currency’s underlying strength, technical analysis offers real-time insights into price patterns and potential entry points. Combining fundamental and technical analysis enables traders to balance economic data with chart patterns, enhancing trade timing and precision. For instance, fundamental economic indicators can provide you with a long-term bias, and technical analysis can be used to find entries and exits in the direction of that bias.


Advanced Trading Techniques


Timing Your Trades


Timing is crucial when trading around economic data releases. Pre-release analysis allows traders to set expectations based on market consensus, whilst post-release strategies can help manage volatility once the data is out. Our Economic Calendar is an indispensable resource in this regard, assisting you in aligning trades with significant data releases and prepare for potential shifts.


Integrating Indicators into Your Trading Strategy


Developing a comprehensive trading strategy involves diversifying currency pairs based on each currency’s economic indicators. For instance, trading a U.S.-based currency pair based on NFP data, while trading an Australian pair based on the RBA’s interest rate decisions, can provide a balanced approach. Incorporating adaptive risk management around key data release dates can help traders mitigate the risks associated with high-impact news events.


Conclusion


Economic indicators are invaluable resources for forex traders, offering insights that can guide trading strategies and improve profitability. By understanding these economic indicators, you can better anticipate currency movements and make informed decisions. However, mastering these indicators requires continuous learning and constant observation.

Ultimately, leveraging economic data within a broader market analysis framework supports responsible trading practices and provides you with an additional source of information to make better trading decisions.


Remember: Successful forex trading requires a balance of economic insight, technical skill, and disciplined risk management. Stay informed, practice consistently, and adapt your strategies to ever-changing market conditions.

07/01/2025
Ready to Start Trading?
Get started live or get a free demo