

What Actually Changes When You Trade Over the Holidays

Read Time: 5 minutes
Search for advice on trading over the Christmas period and you'll find the same warning almost everywhere: spreads blow out in December, so be careful.
It's worth checking that against actual data. Our live and historical spreads tool publishes average, maximum and minimum spreads on every instrument going back years, and it's open to anyone. Pull up AUD/USD, set the range across a few Decembers, and the holiday period looks much like any other. Average spreads stay tight. Maximum spreads spike in the same regular daily pattern they follow all year round – that's the rollover window, not the calendar.
The widening you do see in the data clusters around volatility events, which land whenever they land. Some years that's September. Some years it's March.
So, the common warning is largely wrong. But that doesn't mean December is the same as any other month – it means the risk sits somewhere other than where most articles point.
- What genuinely changes
- The December calendar
- Year-end flows
- The real risk: gaps get longer
- Swaps don't take a holiday
- The quiet trap
- Practical ways to adjust during holidays
The FX market doesn't close for Christmas. It empties out.
From about the second week of December, the participants who provide most of the market's depth wind down – banks close their books for the year, funds stop taking new risk, desks run on skeleton staff. The screens still update and the prices are still live. But the market underneath them is smaller.
Two consequences follow, and neither of them shows up in a spread figure.
Depth falls. Liquidity isn't just the spread between bid and ask – it's how much size sits behind each price level. A quote can look tight and still have very little volume behind it. In a deep market a large order gets absorbed; in a thin one the same order eats through several levels to fill. Prices move further on less genuine conviction.
Closures get longer. This is the big one, and it's covered later.
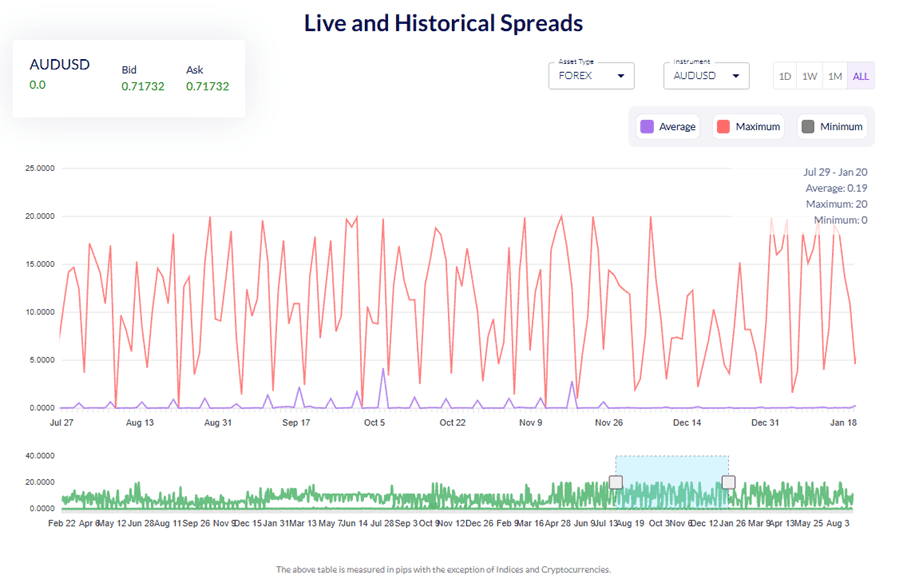
Image 1: Historical spreads - AUDUSD - source: Fusion Markets Live and Historical Spreads
As you can see in Image 1, average spread (purple) holds flat and low across the whole window including December, while maximum spread (red) spikes on a regular daily cycle that is identical in September and December
The period isn't uniform. It has a shape worth knowing.
- Early December is normal, and often busy. The final central bank meetings of the year land here – the Fed, ECB and RBA all typically meet in the first half of the month – and they matter, because they set the tone for January positioning.
- Mid December starts the wind-down. Volume drops, ranges compress, and trends that had been running through November frequently stall. This is where traders get chopped up trying to trade a market that has stopped trending.
- Christmas week is the thinnest stretch of the year. Most major centres close on the 25th and many on the 26th, with reduced hours either side.
- Between Christmas and New Year is quiet but not safe. Thin books and year-end flows overlap here.
- Early January brings everyone back with new positioning. The first full week can be volatile in a way the previous fortnight wasn't, and December ranges built on thin participation often resolve quickly once real liquidity returns.
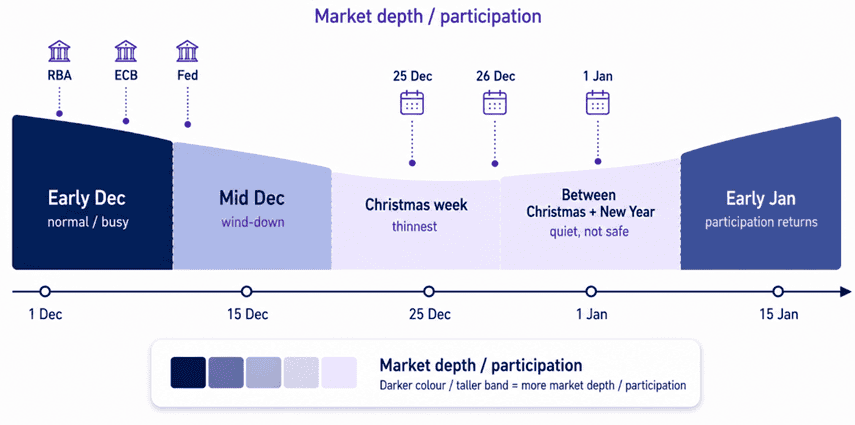
Image 2: Market depth / participation in December.
Fund managers rebalance to hit target allocations. Corporates repatriate earnings and settle cross-border obligations. Banks adjust balance sheets for year-end reporting. None of this reflects a view on where a currency is going – it's mechanical, deadline-driven and largely price-insensitive.
The effect is that a currency can move firmly in one direction for a session or two on flows that reverse in January, because the reason for them expired on the 31st. Reading those moves as the start of a trend is one of the more expensive December mistakes.
These flows concentrate around the London 4pm fix, which is worth avoiding as an entry window during this period unless you have a specific reason to be there.
A gap happens when the market reopens at a different price from where it closed. The ordinary version is the weekend – roughly two days during which news accumulates, and you can't act on it.
Over the holidays those windows stretch. A public holiday adjacent to a weekend produces a three-day closure, and the year-end period bunches several together. More closure time means more opportunity for something to happen while your position sits there, and you can't do anything about it.
This is where the mechanics of order types matter. A stop loss triggers when price touches your level – but a triggered stop becomes a market order, and if there was no trading at your level because price gapped straight past it, you fill wherever the market reopens. The stop worked. It just couldn't work at your price.
Note what this means: your stop distance is not your maximum loss over a closure. Position size has to be survivable at a fill materially worse than your stop, not merely at the stop itself. That's the arithmetic that catches people out, and it has nothing to do with spreads.
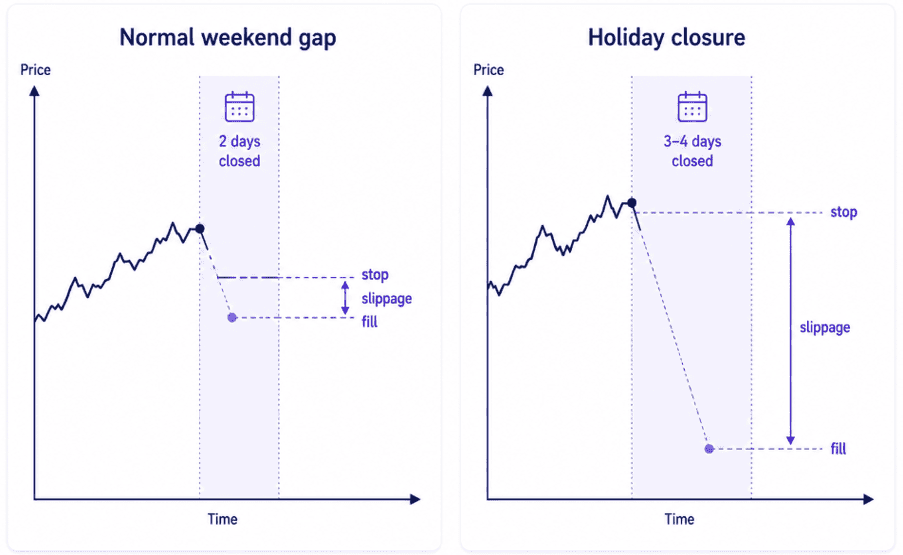
Image 3: Gap risk over closures
Longer holiday closures create more opportunity for price to reopen beyond your stop.
Financing accrues across closures. Holding through a multi-day market closure means paying or receiving swap for each of those days, even though you couldn't have traded during them.
If you're carrying negative-carry positions through the year-end period, that's a cost worth calculating in advance rather than discovering afterwards. Our post on swaps and rollover covers how the charges are worked out.
Thin markets don't feel dangerous. They feel dull. Ranges tighten, volatility readings fall, and the market looks asleep.
But a thin book is a fragile one. Some of the most violent short-term moves in FX have occurred in exactly these conditions – illiquid holiday sessions where a large order or a stop cascade found nothing to absorb it. The early January Asian session has produced more than one.
This is precisely why the spread data is misleading if you read it as an all-clear. Tight average spreads tell you the market is calm right now. They tell you nothing about how much size is standing behind those quotes if something breaks.
Low realised volatility and low risk are not the same thing.
None of this argues for sitting out the month. It argues for trading it differently.
- Reduce position size.
Rather than widening stops. Widening a stop keeps your risk the same while giving up more room; reducing size actually lowers it. - Check the holiday schedule.
Before you enter any position, know which days your instruments are closed or on reduced hours. - Size for the gap, not the stop.
Assume a fill beyond your level on anything carried through a closure. - Trade the liquid windows.
London and the London-New York overlap retain more depth than Asia through this period. - Be sceptical of breakouts.
A level breaking on holiday participation is much weaker evidence than the same break in November. - Flatten positions before extended closures.
Unless you have a specific reason to carry the position.
The traders who come out of December on top are usually the ones who traded less of it, in smaller size, and spent the quiet weeks reviewing the year rather than forcing trades out of a market with nothing to give.
If you want to keep up to date with economic news and events all year round, be sure to add the Fusion Economic Calendar to your bookmarks.
We’ll never share your email with third-parties. Opt-out anytime.